Source page: McKinsey & Company
Commentary
Decentering gen AI
Artificial Intelligence | Banking
May 1, 2024 – Across the global banking sector, generative (gen AI) could add between $200 billion and $340 billion in value annually, largely through increased productivity, according to senior partner Kevin Buehler and coauthors. As banks and other financial institutions implement the technology, four organizational archetypes have appeared, ranging from highly centralized to highly decentralized. In a study of 16 of the largest financial institutions across Europe and the United States, more than 50 percent are opting for a more centralized approach, though structures are likely to become more decentralized in the longer term, as use of the new technology matures.
To read the article, see “Scaling gen AI in banking: Choosing the best operating model,” March 22, 2024.
customizer here
Visual form
Comparison infographic.
Layout / body structure
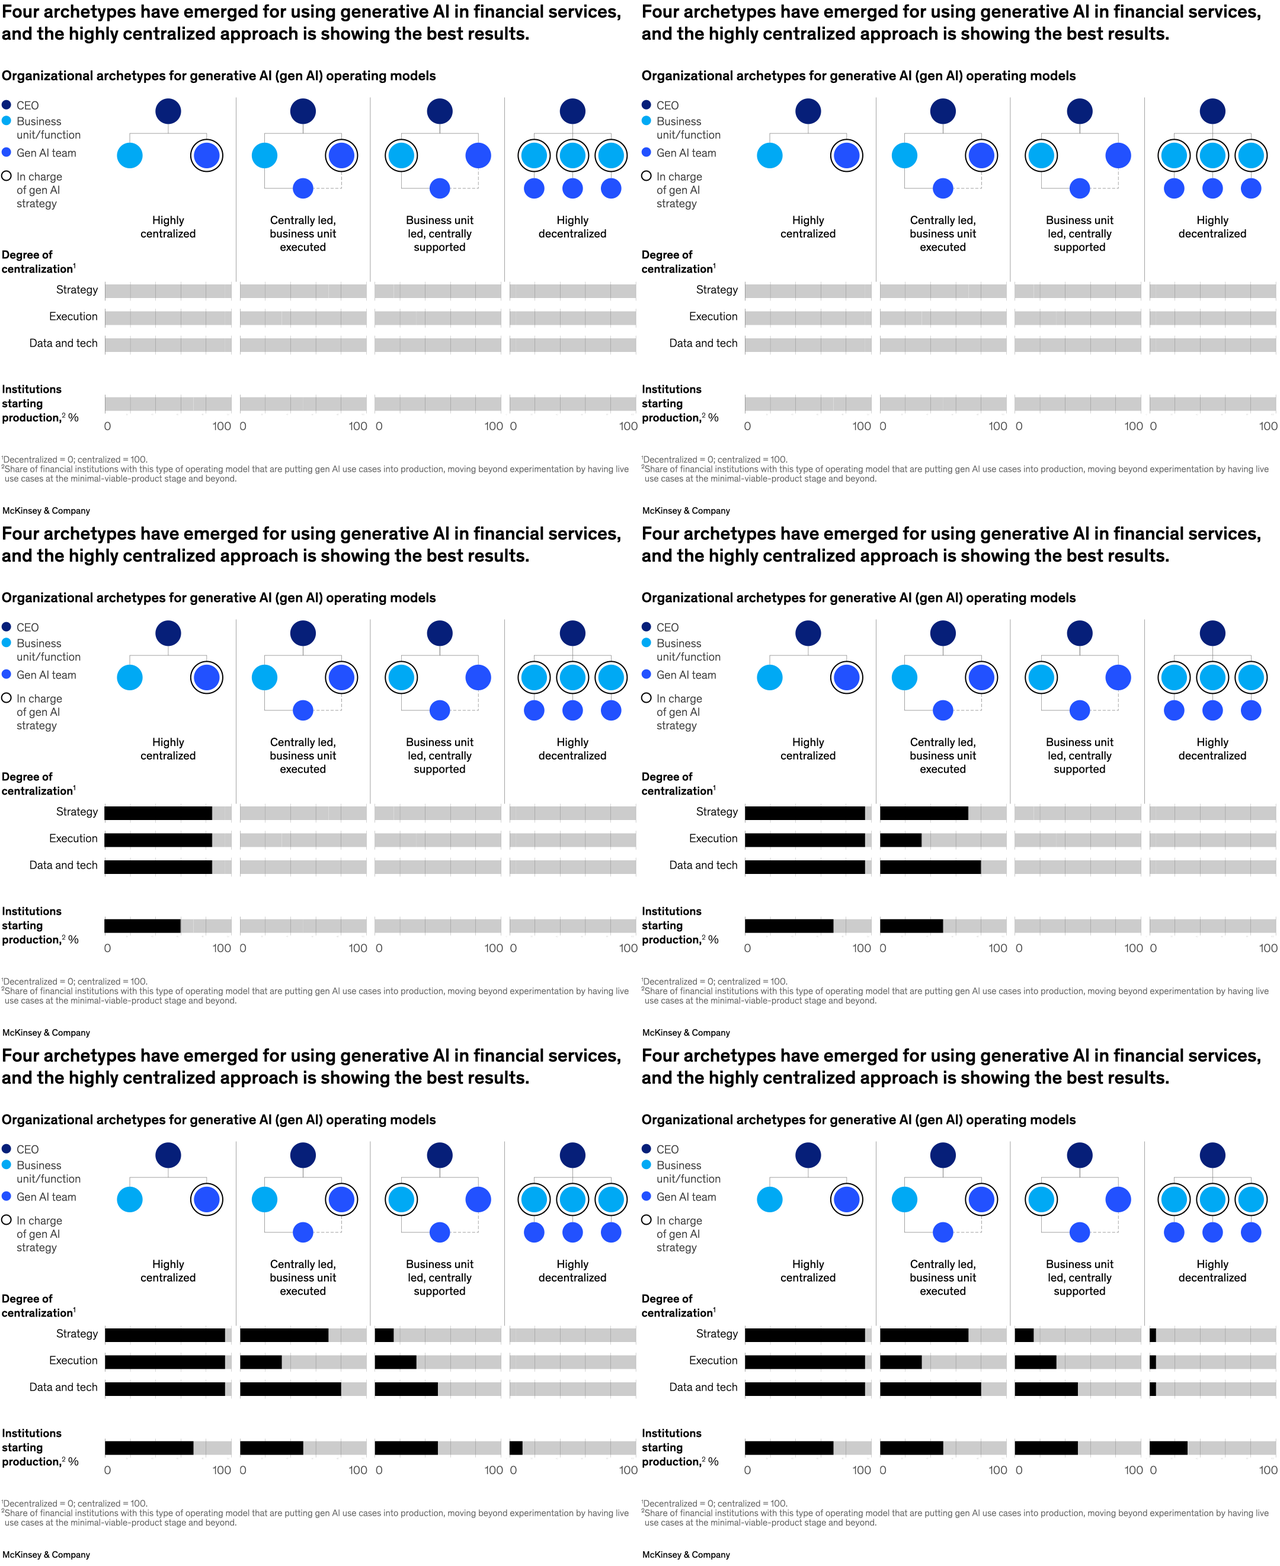
The page is organized as a left-to-right sequence of four operating-model archetypes. Read each column from top to bottom, starting with the circle cluster at the top and then the horizontal decentralization bars below it.
What is being compared
It compares four operating-model archetypes for generative AI in financial services: highly centralized, centrally led with business-unit execution, business-unit led with central support, and highly decentralized.
Measurement system
The chart uses organizational-positioning cues rather than one shared numeric axis. Circle placement and size indicate where ownership sits, while the black and gray bars below summarize the degree of centralization across strategy, execution, and data-and-tech responsibilities, with production rates shown beneath each archetype.
Visible structure inside the graphic
Each archetype column combines a small node diagram at the top with horizontal responsibility bars below. The columns shift from concentrated ownership on the left to distributed ownership on the right, making the organizational differences visible before the reader even gets to the labels.
Main takeaway from the visual
The chart shows that the highly centralized model is producing the strongest results, while the more distributed models spread responsibility more widely and appear less effective at turning use cases into production outcomes.
Key standout values or extremes
The highly centralized column is the most consolidated visually and is paired with the best production result on the page. The farther-right decentralized columns show more dispersed circles and lighter responsibility bars, signaling more fragmented ownership.
Controls / sequence, when applicable
This is a static chart image with no in-chart controls to operate.
Companion media, when applicable
There is no separate companion audio or video; the chart image is the full visual on this page.