Source page: McKinsey & Company
Commentary
Decoding deal delays
M&A | Strategy
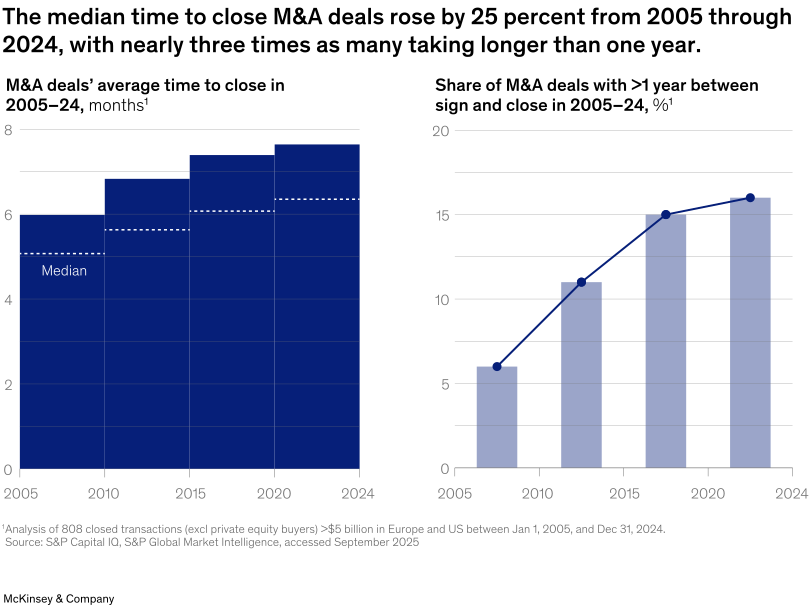
December 3, 2025 – The time it takes to finalize M&A deals has been on the rise over the past two decades. From 2005 through 2024, the median time between signing and closing stretched to about 6.4 months, a 25 percent increase from 20 years ago, explain Partner Anthony Luu and coauthors. Across geographies and industries, regulatory scrutiny is a primary cause of the delays. To close the gap, organizations can consider incorporating “clean teams” that focus on integration planning, day-one readiness, and value capture before the deal closes.
To read the article, see “Deal delays are the new normal. Clean teams are the fix,” October 14, 2025.
customizer here
Visual form
Bar Chart and Line Chart: two-panel M&A closing-delay comparison from 2005 to 2024.
Layout / body structure
The left panel shows average deal-closing time across period blocks, and the right panel shows the share of deals taking more than one year. The reader moves left to right from how long deals take to how often the longest delays occur.
What is being compared
It compares M&A timing over two decades by measuring both median months from signing to close and the percentage of signed deals that required more than a year to complete.
Measurement system
The left panel is measured in months, while the right panel is measured in percent of deals. Calendar ranges run from 2005 through 2024, with direct labels and reference markers used to make the change readable.
Visible structure inside the graphic
The left panel uses stepped blocks to show closing time rising across successive periods. The right panel combines vertical bars with a marker line, making the growth in one-year-plus deals visible as both columns and connected points.
Main takeaway from the visual
The chart shows that deal execution has slowed in two related ways: the typical closing window has lengthened, and deals that stretch beyond one year have become much more common.
Key standout values or extremes
Median closing time rose 25 percent from 2005 through 2024, reaching about 6.4 months. The share of deals taking longer than one year increased from about 6 percent to about 16 percent, nearly tripling over the period.
Controls / sequence, when applicable
This is a fixed two-panel bar-and-line chart; there are no in-chart controls to operate.
Companion media, when applicable
There is no separate companion audio or video; the M&A closing-delay chart is the visual on this page.