Source page: McKinsey & Company
Commentary
Different paths, but a common goal
Decarbonization | Sustainability
January 18, 2023 – Davos—the World Economic Forum’s annual meeting—is in full swing through January 20. All this week, our daily charts will focus on some of the key themes of the event, including resilience, sustainability, reimagining globalization, inclusion, and space. For more, see “McKinsey and the World Economic Forum 2023.”
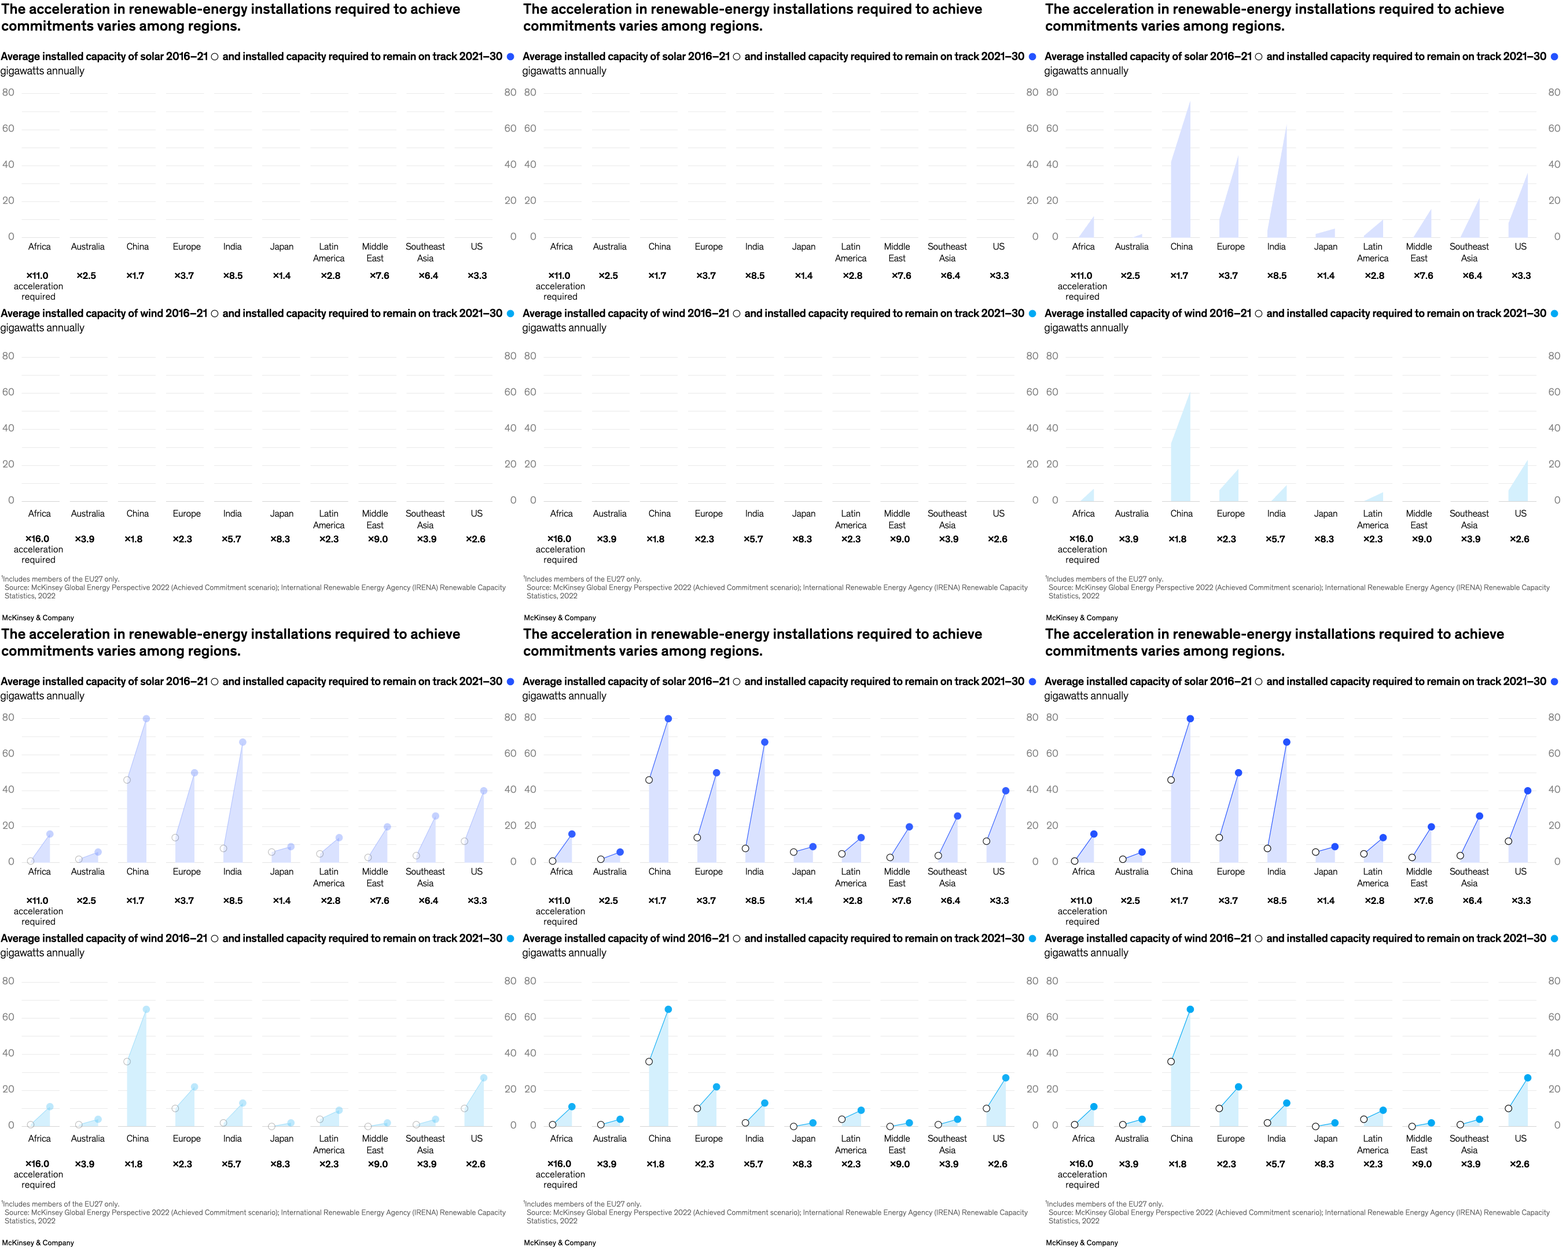
To get the energy transition on track—and fend off the worst effects of climate change—renewables need to scale up globally. Annual solar and wind installed capacity will need to nearly triple, from approximately 180 gigawatts (GW) of average yearly installed capacity in 2016–21 to more than 520 GW by 2030, according to senior partners Daniel Pacthod, Hamid Samandari, and Humayun Tai and coauthors. Different accelerations are needed across global regions.
To read the report, see “The energy transition: A region-by-region agenda for near-term action,” December 15, 2022.
customizer here
Visual form
Regional acceleration comparison chart.
Layout / body structure
The page is laid out as a regional comparison rather than as a single global aggregate. Reader moves region by region to see how much the required build-out of renewable capacity differs across geographies on the road to the same overall goal.
What is being compared
It compares the pace of solar and wind build-out different regions need in order to stay on track for the energy transition and broader climate commitments.
Measurement system
The main unit is installed renewable capacity in gigawatts, paired with the implied acceleration required to move from the recent average build-out to the 2030 target level.
Visible structure inside the graphic
The chart is organized around regional categories with separate bars, markers, or segments showing the scale-up needed in each case. The layout emphasizes side-by-side regional differences rather than collapsing everything into one global line.
Main takeaway from the visual
The chart shows that the destination is shared but the starting points are not. Some regions need a much steeper acceleration than others, which is why the energy transition has to be managed region by region rather than with one uniform global playbook.
Key standout values or extremes
The page highlights that annual solar and wind installations need to rise from about 180 gigawatts a year in 2016 – 21 to more than 520 gigawatts by 2030. The regional comparison is built around how uneven that acceleration requirement is across the world.
Controls / sequence, when applicable
This is a static chart image with no in-chart controls to operate.
Companion media, when applicable
There is no separate companion audio or video; the chart image is the full visual on this page.