Source page: McKinsey & Company
Commentary
Digital adoption gains steam—but not for grocery
COVID-19 | Economy
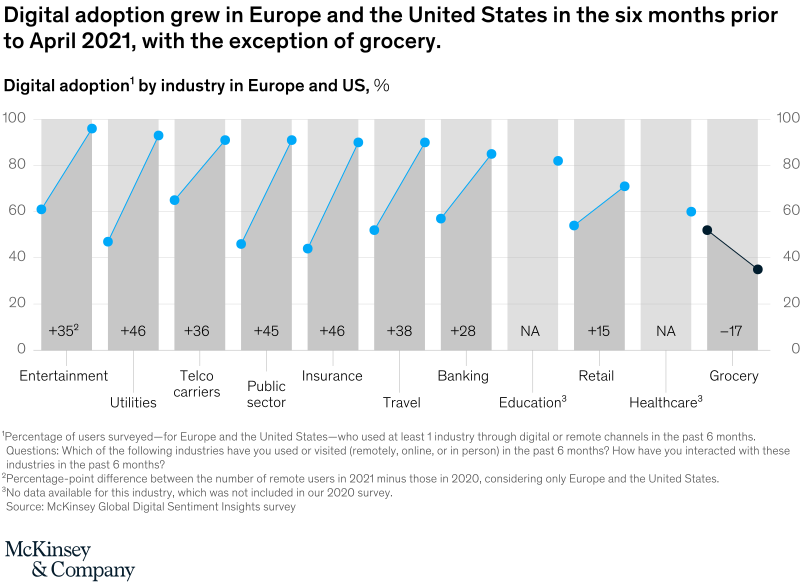
June 14, 2021 – When the pandemic forced businesses to close their doors to foot traffic, industries such as utilities and insurance saw a boost of as much as 46 percent in consumer engagement with their digital channel offerings. But grocery shoppers want to pick their own produce again, leading to a drop in engagement with grocers’ digital channels of about 17 percent. Some industries in the European Union also saw declines in digital adoption, particularly among banking, retail, and telco carriers.
To read the article, see “What’s next for digital consumers,” May 23, 2021.
customizer here
Visual form
Industry-by-industry slope chart.
Layout / body structure
The chart is laid out as a single horizontal strip of industries, with one mini comparison per industry sharing the same 0 to 100 percent scale. Read left to right from entertainment through grocery, using the sloped blue or black segment and the numeric change label at the bottom of each industry panel together.
What is being compared
The chart compares digital adoption in the six months prior to April 2021 with the same measure in 2020 across industries in Europe and the United States. It covers entertainment, utilities, telco carriers, public sector, insurance, travel, banking, education, retail, healthcare, and grocery.
Measurement system
The vertical scale is percent of surveyed users who used an industry through digital or remote channels in the past six months. Each industry shows a start point and end point joined by a line, and the small label at the bottom gives the net change in percentage points from the earlier year to the 2021 reading.
Visible structure inside the graphic
Each industry panel is a compact two-point slope with the more recent dot placed higher or lower than the earlier dot, so the direction of change is immediately visible. Most panels climb sharply upward in blue, education and healthcare are marked as not available for one side of the comparison, and grocery alone is shown with a downward black slope instead of an upward blue one.
Main takeaway from the visual
Digital adoption rose across nearly every measured industry between 2020 and April 2021, but grocery moved in the opposite direction. The chart makes that exception unmistakable because every available industry line tilts upward except the final grocery panel, which drops from just above 50 percent to the mid-30s.
Key standout values or extremes
Entertainment posts the largest increase at plus 35 percentage points, followed by utilities and insurance at plus 46, public sector at plus 45, travel at plus 38, banking at plus 28, and retail at plus 15. Grocery is the only negative change at minus 17 percentage points, while education and healthcare are marked NA because comparable 2020 data were not available.
Controls / sequence, when applicable
This is a static chart image with no in-chart controls to operate.
Companion media, when applicable
There is no separate companion audio or video; the chart image is the full visual on this page.