Source page: McKinsey & Company
Commentary
Digital attackers bring it on
Mobile | Consumer
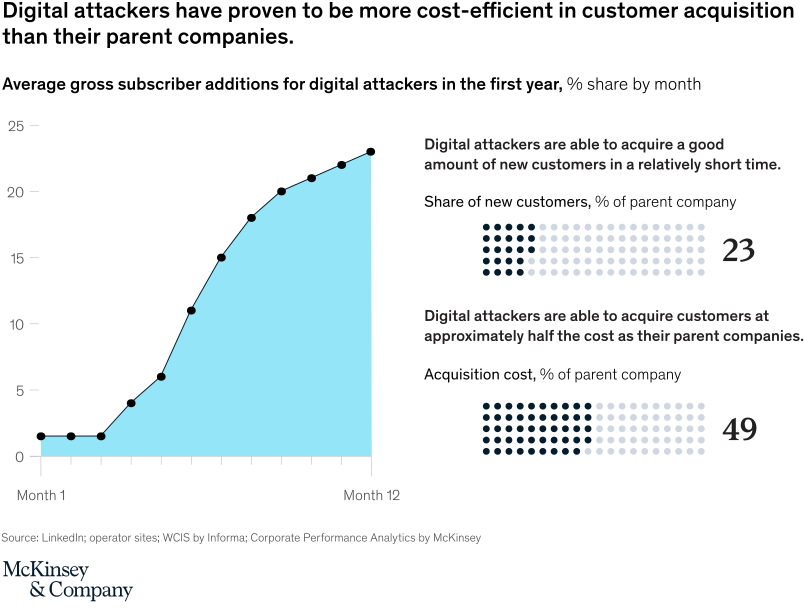
February 28, 2022 – Would you buy mobile service from FUNK, or yallo swype? Many people say yes. As telecoms types gather at Mobile World Congress 2022, new digital brands are sure to be a topic of discussion. Frustrated by slow growth in their traditional brands, some operators have launched new digital attackers, which are proving successful. Within four quarters from launch, the typical digital attacker has contributed close to 25 percent of overall gross additional subscribers (gross adds) to the incumbent operator, at lower cost.
To read the article, see “A battle plan for telcos’ digital-attacker brands,” March 5, 2021.
customizer here
Visual form
Time-series line chart with side callouts.
Layout / body structure
The chart places a month-by-month line chart on the left and explanatory callout text on the right. Reader follows the gross-subscriber-additions line from Month 1 to Month 12 and then reads the side notes that summarize customer-acquisition speed and acquisition-cost efficiency.
What is being compared
The chart compares the average gross subscriber additions of digital attackers in the first year after launch and sets that growth story beside acquisition-cost comparisons with parent companies. It is comparing both customer-acquisition share over time and acquisition efficiency versus incumbents.
Measurement system
The left chart uses percentage share by month, with the y-axis marked at 10, 15, 20, and 25 percent and the x-axis running from Month 1 to Month 12. The right-side callout uses acquisition cost as a percent of the parent company’s cost, with a highlighted 49 percent figure.
Visible structure inside the graphic
A rising line occupies the left half of the page, climbing across the first year to show the growing share of new customers captured by digital attackers. On the right, two stacked text blocks translate the line into plain language and then add a separate cost-efficiency statement anchored by the 49 percent acquisition-cost number.
Main takeaway from the visual
Digital attackers ramp up new-customer acquisition quickly and do so at materially lower cost than their parent companies. The upward line on the left and the half-cost callout on the right reinforce each other, so the page reads as a two-part case for digital attackers’ efficiency rather than a narrow volume-only story.
Key standout values or extremes
The monthly share line reaches into the mid-20 percent range by Month 12, which is the visible peak of the acquisition curve. The clearest cost anchor is 49 percent, indicating acquisition costs at roughly half of the parent-company level.
Controls / sequence, when applicable
This is a static chart image with no in-chart controls to operate.
Companion media, when applicable
There is no separate companion audio or video; the chart image is the full visual on this page.