Source page: McKinsey & Company
Commentary
Disruptor OEMs outpace rivals
China | Automotive
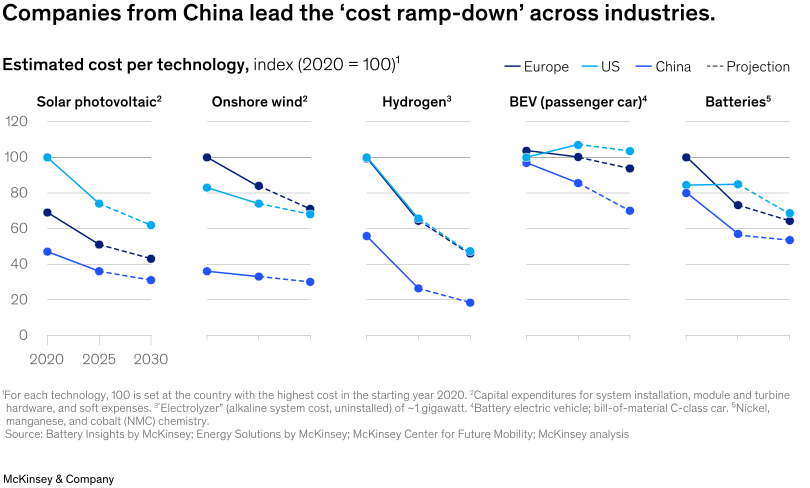
October 29, 2025 – Disruptor OEMs are deploying new operating models that can accelerate performance and outpace incumbents. For example, Chinese OEMs producing battery electric vehicles (BEVs) in 2020 were on cost parity with established European and US OEMs. Now, the Chinese OEMs have cut costs by up to 20 percent compared with their peers, Senior Partner Tomas Nauclér and colleagues explain. Across sectors, disruptor OEMs have also managed to innovate at a pace that is two to three times faster than established OEMs.
To read the article, see “‘Innovation Execution’—a new industrial paradigm emerges,” September 4, 2025.
customizer here
Visual form
Line Chart: five-panel small-multiple cost-index forecast for clean-technology manufacturing.
Layout / body structure
Five mini charts run left to right for solar photovoltaic, onshore wind, hydrogen, battery electric vehicles, and batteries. Each panel keeps the same indexed cost scale and plots Europe, the United States, and China as separate lines.
What is being compared
It compares cost trajectories for the three regions across five technologies, showing both the 2020-to-2025 movement and the projected 2030 endpoint.
Measurement system
Costs are indexed to 2020 equals 100. The horizontal axis uses 2020, 2025, and 2030, with solid lines for observed movement and dashed line segments for the forecast portion.
Visible structure inside the graphic
Each panel repeats three color-coded lines with point markers. Most lines slope downward, but the Chinese line generally sits lowest by 2030, while the US battery-electric-vehicle line remains above its 2020 index.
Main takeaway from the visual
The chart shows China moving down the cost curve faster and farther than Europe or the United States across most of the technologies shown.
Key standout values or extremes
China falls to roughly 31 in solar photovoltaic, 30 in onshore wind, 18 in hydrogen, and 54 in batteries by 2030. In battery electric vehicles, China drops to about 70 while Europe stays around the low 90s and the United States remains above 100.
Controls / sequence, when applicable
This is a fixed small-multiple line chart; there are no in-chart controls to operate.
Companion media, when applicable
There is no separate companion audio or video; the cost-index line chart is the visual on this page.