Source page: McKinsey & Company
Commentary
Don’t just blame the beef
Food | Sustainability
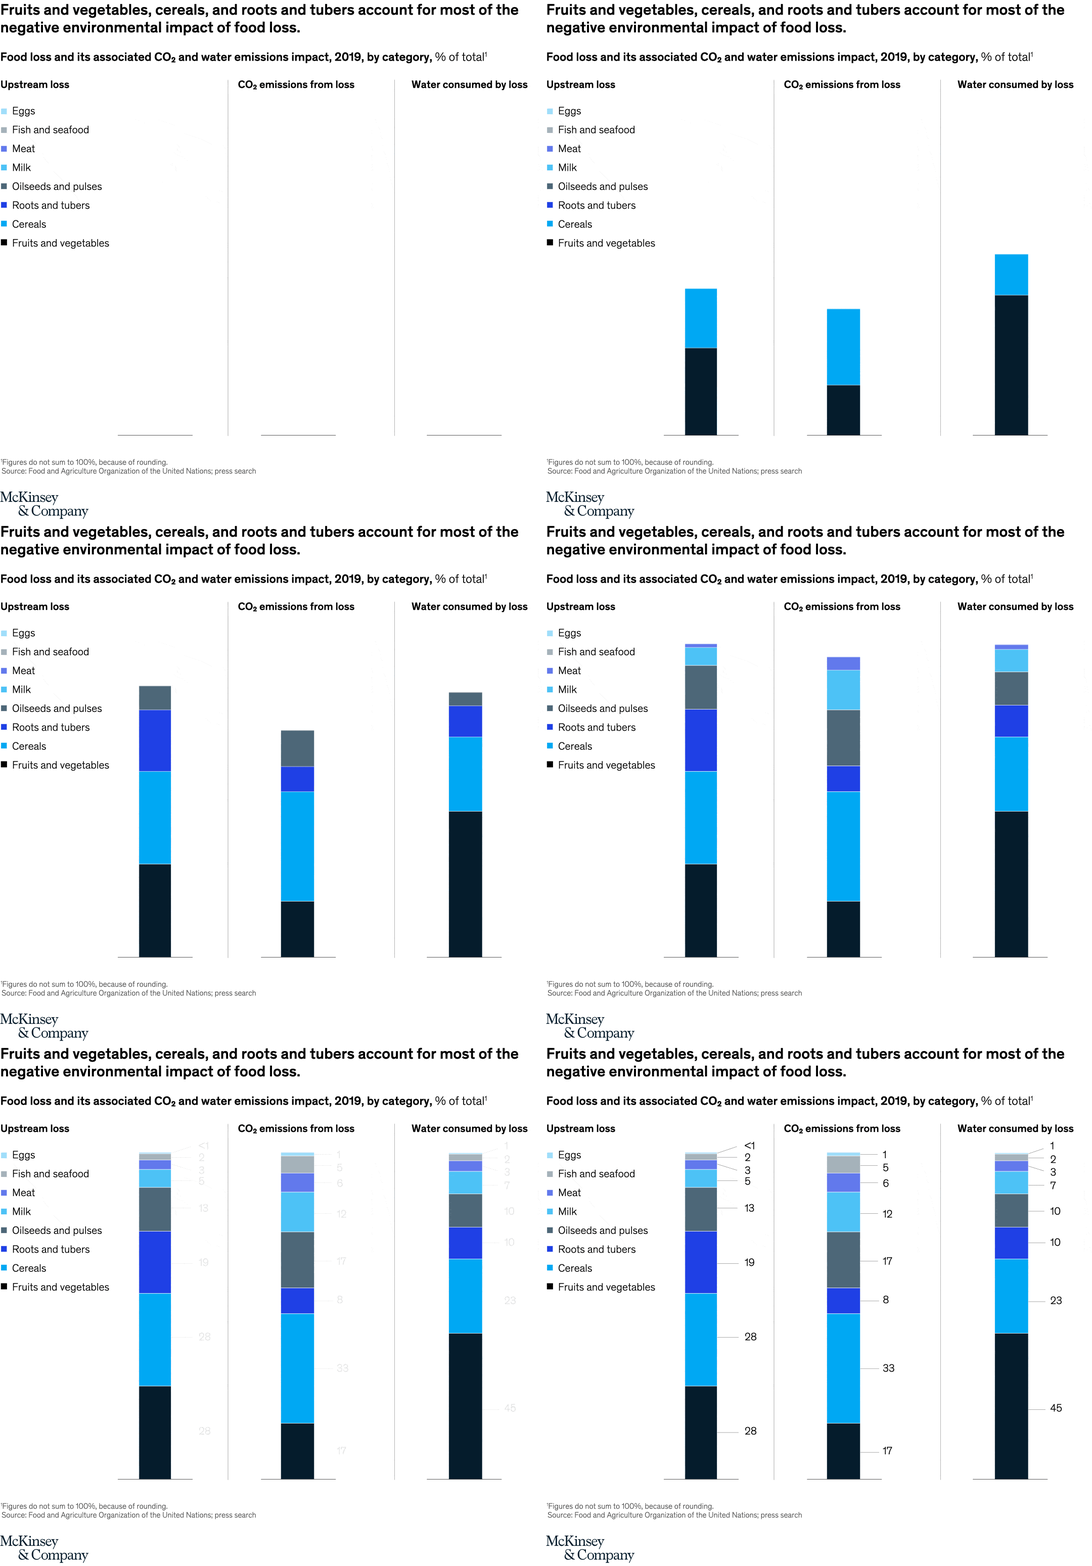
December 16, 2022 – The environmental impact of meat and dairy receives a lot of media attention—for good reason. But the impact of food loss and waste too often goes undiscussed. Senior partners Clarisse Magnin and Björn Timelin and coauthors found that up to 40 percent of the world’s food is lost or wasted every year. Fruits and vegetables, cereals, and roots and tubers account for most of the CO2 emissions and water use from this food loss.
To read the article, see “Reducing food loss: What grocery retailers and manufacturers can do,” September 7, 2022.
customizer here
Visual form
Category impact bar chart.
Layout / body structure
The chart is structured as a category comparison across food types, with the reader moving through major groups to see which ones account for the most environmental damage from food loss. The layout reads as a ranked breakdown rather than as a time series.
What is being compared
It compares the environmental impact of food loss across categories such as fruits and vegetables, cereals, roots and tubers, and meat and dairy.
Measurement system
The chart compares environmental burden rather than price or revenue, using emissions and waste-related impact across the food categories. The category labels and bar lengths carry the main comparison.
Visible structure inside the graphic
The main pieces are the food-category rows or bars and the visual ordering that puts the biggest contributors in clearer view. The chart is organized to counter the assumption that meat alone dominates every part of the food-loss story.
Main takeaway from the visual
The page shows that food-loss damage is distributed much more broadly than the usual focus on beef suggests. Fruits and vegetables, cereals, and roots and tubers dominate much of the impact once food loss itself becomes the lens.
Key standout values or extremes
The article framing notes that up to 40 percent of the world’s food is lost or wasted every year. The chart then highlights fruits and vegetables, cereals, and roots and tubers as the categories accounting for most of the negative environmental impact tied to that loss.
Controls / sequence, when applicable
This is a static chart image with no in-chart controls to operate.
Companion media, when applicable
There is no separate companion audio or video; the chart image is the full visual on this page.