Source page: McKinsey & Company
Commentary
Double trouble
Inflation | Economy
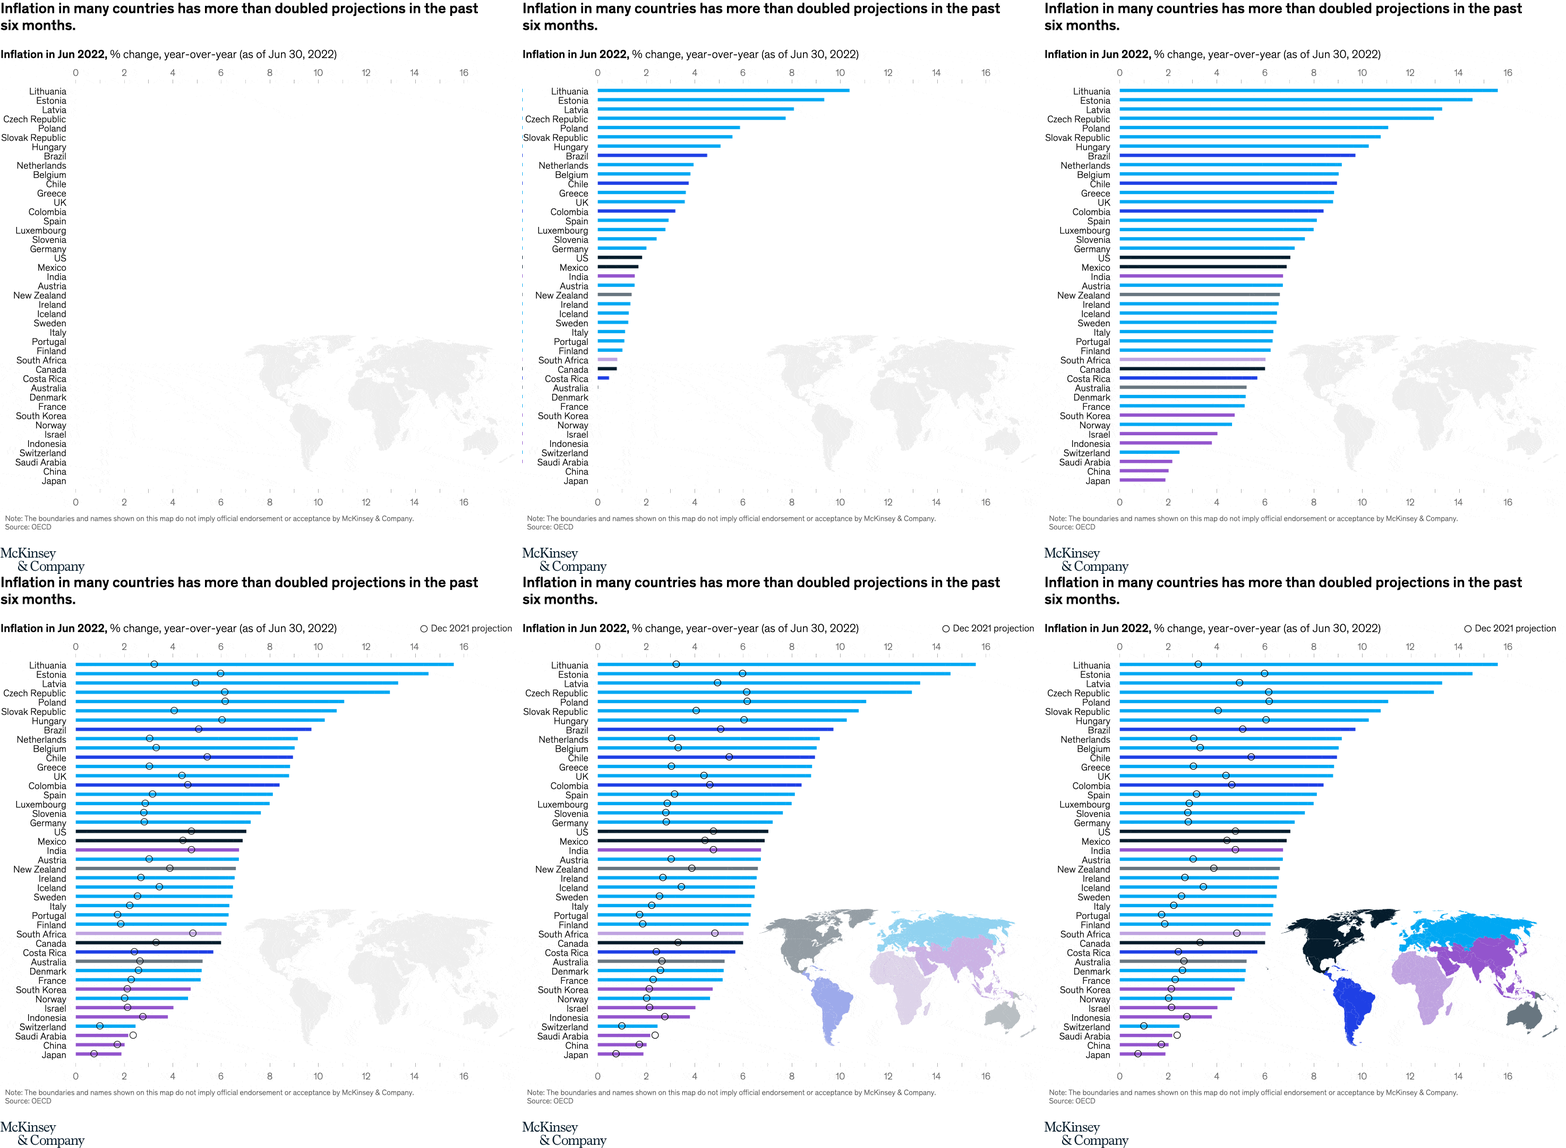
July 18, 2022 – Inflation jumped globally in the past six months, and in some nations it has more than doubled the predictions from December 2021. Countries in Europe have generally been hit hardest—Lithuania tops the list with a 15.5 percent jump. Increases across Asia, however, have been less severe, with some nations remaining close to last year’s projections.
To read the article, see “How inflation is flipping the economic script, in seven charts,” July 6, 2022.
customizer here
Visual form
Ranked horizontal bar chart with comparison dots and a regional map inset.
Layout / body structure
The chart is read from top to bottom as a country ranking, with the longest bars at the top and shorter ones trailing downward. Small comparison dots sit on each row to show the earlier projection against the later inflation outcome, and a color-coded world map in the lower-right corner groups the countries by region.
What is being compared
The chart compares actual 2022 inflation by country and sets it against each country’s December 2021 projection. It therefore shows both the level of inflation and how far reality overshot what forecasters expected only six months earlier.
Measurement system
The horizontal axis is inflation in 2022, measured as year-over-year change as of June 30, 2022. Bar length shows the actual reading, while the smaller dots show the December 2021 projection on the same numeric scale.
Visible structure inside the graphic
The bars form a steep descending ladder, with a cluster of double-digit European readings at the top and much shorter bars farther down the list. The separation between each bar end and its corresponding projection dot makes the forecast miss visible row by row, instead of hiding it in a separate table.
Main takeaway from the visual
The chart shows that inflation accelerated far beyond what had been expected across much of the world, with Europe hit hardest. In many countries the actual bar extends well beyond the projection dot, which is exactly what makes the “double trouble” framing visible rather than rhetorical.
Key standout values or extremes
Lithuania sits at the very top at 15.5 percent. Several other European countries also land in the low-to-mid teens, while a number of Asian readings stay much closer to the low single digits and near their earlier forecasts.
Controls / sequence, when applicable
This is a static chart image with no in-chart controls to operate.
Companion media, when applicable
There is no separate companion audio or video; the chart image is the full visual on this page.