Source page: McKinsey & Company
Commentary
Down but not out
Financial services | Investing
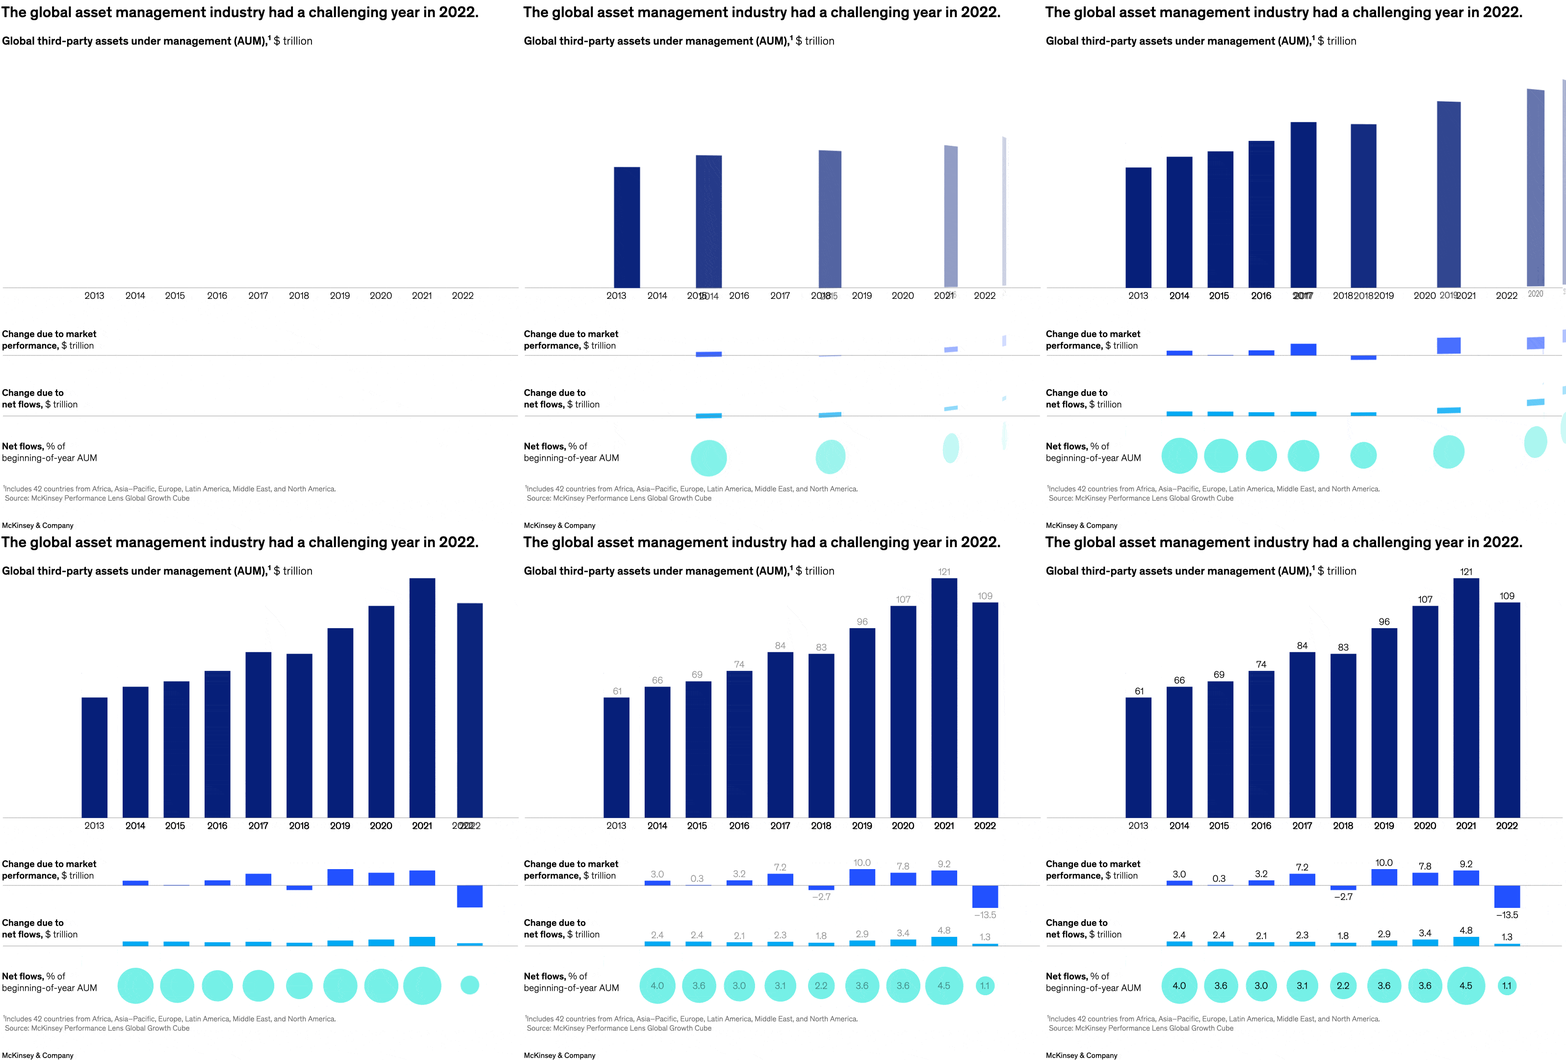
December 21, 2023 – The asset management industry has experienced its share of shocks over the past 18 months, from surging inflation and interest rates to geopolitical tensions. Senior partner Ju-Hon Kwek and colleagues find that global assets under management declined by 10 percent in 2022, while net flows slowed to near zero in every region except Asia–Pacific. Total global net flows registered 1.1 percent, in contrast to the norm of 3 to 4 percent during the past decade. But new stresses can lead to new opportunities. Asset managers can consider a three-part agenda going forward: create new strategic positioning for investment and product platforms; reengineer operating models to build greater flexibility and agility; and upgrade firms’ execution capabilities, focusing on distribution and strategic partnerships.
To read the report, see “Everything everywhere all at once: North American asset management 2023,” November 28, 2023.
As 2023 wraps up, don’t miss our feature, “2023: The year in charts,” highlighting data visualizations that help tell the story of the past year—and what leaders might puzzle through in years to come. Chart of the Day will go on a brief hiatus starting December 22, 2023 and will return January 8, 2024. In the meantime, check out “Only McKinsey: Highlights from our 2023 ‘Insights to Impact’ publishing journey” to dive into the year’s biggest themes.
customizer here
Visual form
Composite bar-and-metric-strip chart. The chart combines a top bar chart for total assets under management with aligned lower rows for performance and flow measures.
Layout / body structure
Layout / body structure: the graphic is read from top to bottom. Reader first sees the main annual AUM bars, then moves down through three coordinated metric strips that explain how market performance and net flows contributed to the yearly change.
What is being compared
What is being compared: the top panel compares global third-party assets under management across successive years, while the lower rows compare the annual contribution of market performance and investor flows. The combined layout lets the reader compare level, driver, and flow rate in one integrated chart.
Measurement system
Measurement system: the top and middle rows are labeled in trillions of dollars, and the bottom strip expresses net flows as a percentage of beginning-of-year AUM. The reader tracks the bar heights in the top panel and then reads the printed positive and negative values in the aligned rows below.
Visible structure inside the graphic
Visible structure inside the graphic: the chart is organized around tall annual bars in the top row and three horizontally aligned data strips underneath: change due to market performance, change due to net flows, and net flows as a share of opening AUM. This stacked analytic layout shows both the asset stock and the mechanics behind year-to-year movement.
Main takeaway from the visual
Main takeaway from the visual: the industry rose for years and then gave back ground in 2022 because market performance turned sharply negative while flows weakened. The lower strips make the cause of the drop visible instead of leaving the reader to infer it only from the top-line AUM bar decline.
Key standout values or extremes
Key standout values or extremes: global third-party AUM rises to 121 trillion before falling to 109 trillion in the final bar. The market-performance row shows a negative 13.5 trillion swing, and the net-flows-rate row drops to 1.1 percent, which is the weakest percentage shown in the strip.
Controls / sequence, when applicable
This is a static chart image with no in-chart controls to operate.
Companion media, when applicable
There is no separate companion audio or video; the chart image is the full visual on this page.