Source page: McKinsey & Company
Commentary
Drilling down on geothermal capacity
Energy | Sustainability
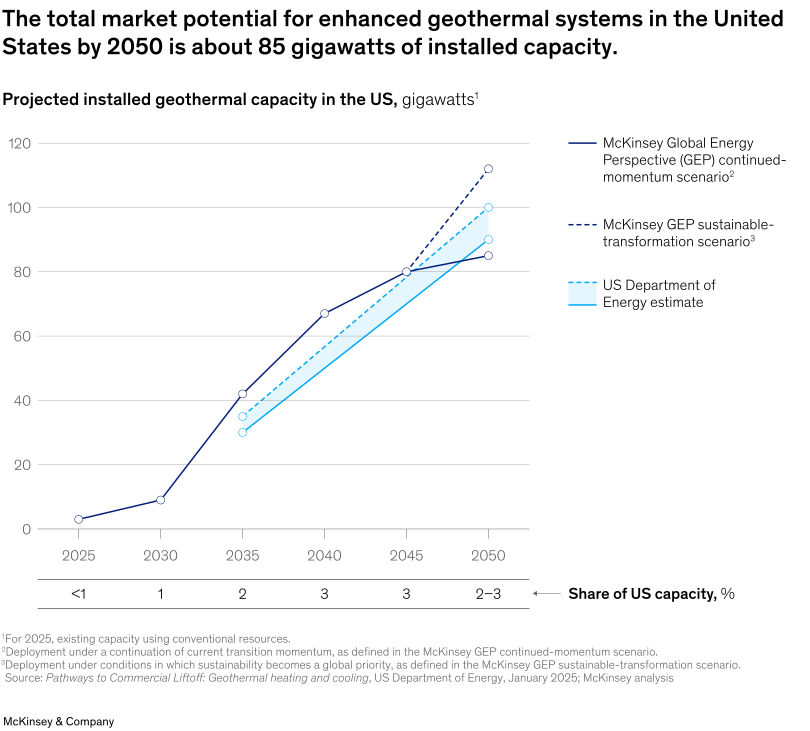
August 13, 2025 – US energy demand is expected to climb in the next decade, driven in part by data center load growth and electrification. Senior Partner Adam Barth and colleagues find that next-generation geothermal energy, when deployed as a grid resource competing with other technologies in the United States, has the capacity to increase steadily from 1 gigawatt this year to more than 80 gigawatts by 2050. Under conditions in which sustainability becomes a global priority, geothermal capacity could reach close to 110 gigawatts.
To read the article, see “Is geothermal energy ready to make its mark in the US power mix?,” July 17, 2025.
customizer here
Visual form
Scenario line chart.
Layout / body structure
This is a single chart read left to right across time, with the legend placed on the right and a secondary capacity-share strip running beneath the main plot. The main lines track projected installed geothermal capacity through 2050 under different scenarios.
What is being compared
It compares three geothermal-capacity projections for the United States: a McKinsey continued-momentum scenario, a McKinsey sustainable-transformation scenario, and a US Department of Energy estimate. The comparison runs from 2025 through 2050.
Measurement system
The vertical axis measures gigawatts of installed capacity, while the horizontal axis marks time in 2025, 2030, 2035, 2040, 2045, and 2050. The strip underneath reports geothermal’s share of US capacity in percentage terms at the same time markers.
Visible structure inside the graphic
A solid dark-blue line climbs from a very low starting point in 2025 to about 80 gigawatts by 2045 and about 85 by 2050 in the continued-momentum scenario. Two dashed or lighter-blue scenario paths branch from the mid-2030s onward, with one reaching about 100 gigawatts by 2050 and another extending to roughly 112. The bottom strip adds share-of-US-capacity labels that move from less than 1 percent in 2025 to 2 to 3 percent by 2050.
Main takeaway from the visual
The chart shows that enhanced geothermal systems could become a much more material part of the U.S. energy mix by midcentury, with all scenarios rising sharply and the more aggressive transformation path reaching well above the base trajectory.
Key standout values or extremes
The title anchors the central estimate at about 85 gigawatts by 2050. The DOE estimate reaches about 90, and the sustainable-transformation scenario climbs to roughly 112. The share strip shows geothermal rising from under 1 percent of capacity today to around 2 to 3 percent by 2050.
Controls / sequence, when applicable
This is a static chart image with no in-chart controls to operate.
Companion media, when applicable
There is no separate companion audio or video; the chart image is the full visual on this page.