Source page: McKinsey & Company
Commentary
Eating their own cooking: Chipmakers can benefit from AI
Semiconductors | Artificial Intelligence
April 23, 2021 – Semiconductor firms make the chips that power artificial intelligence (AI). But only 30 percent use AI themselves. If they make full use of the technology, they could add up to $95 billion in profit.
To read the article, see “Scaling AI in the sector that enables it: Lessons for semiconductor-device makers,” April 2, 2021.
customizer here
Visual form
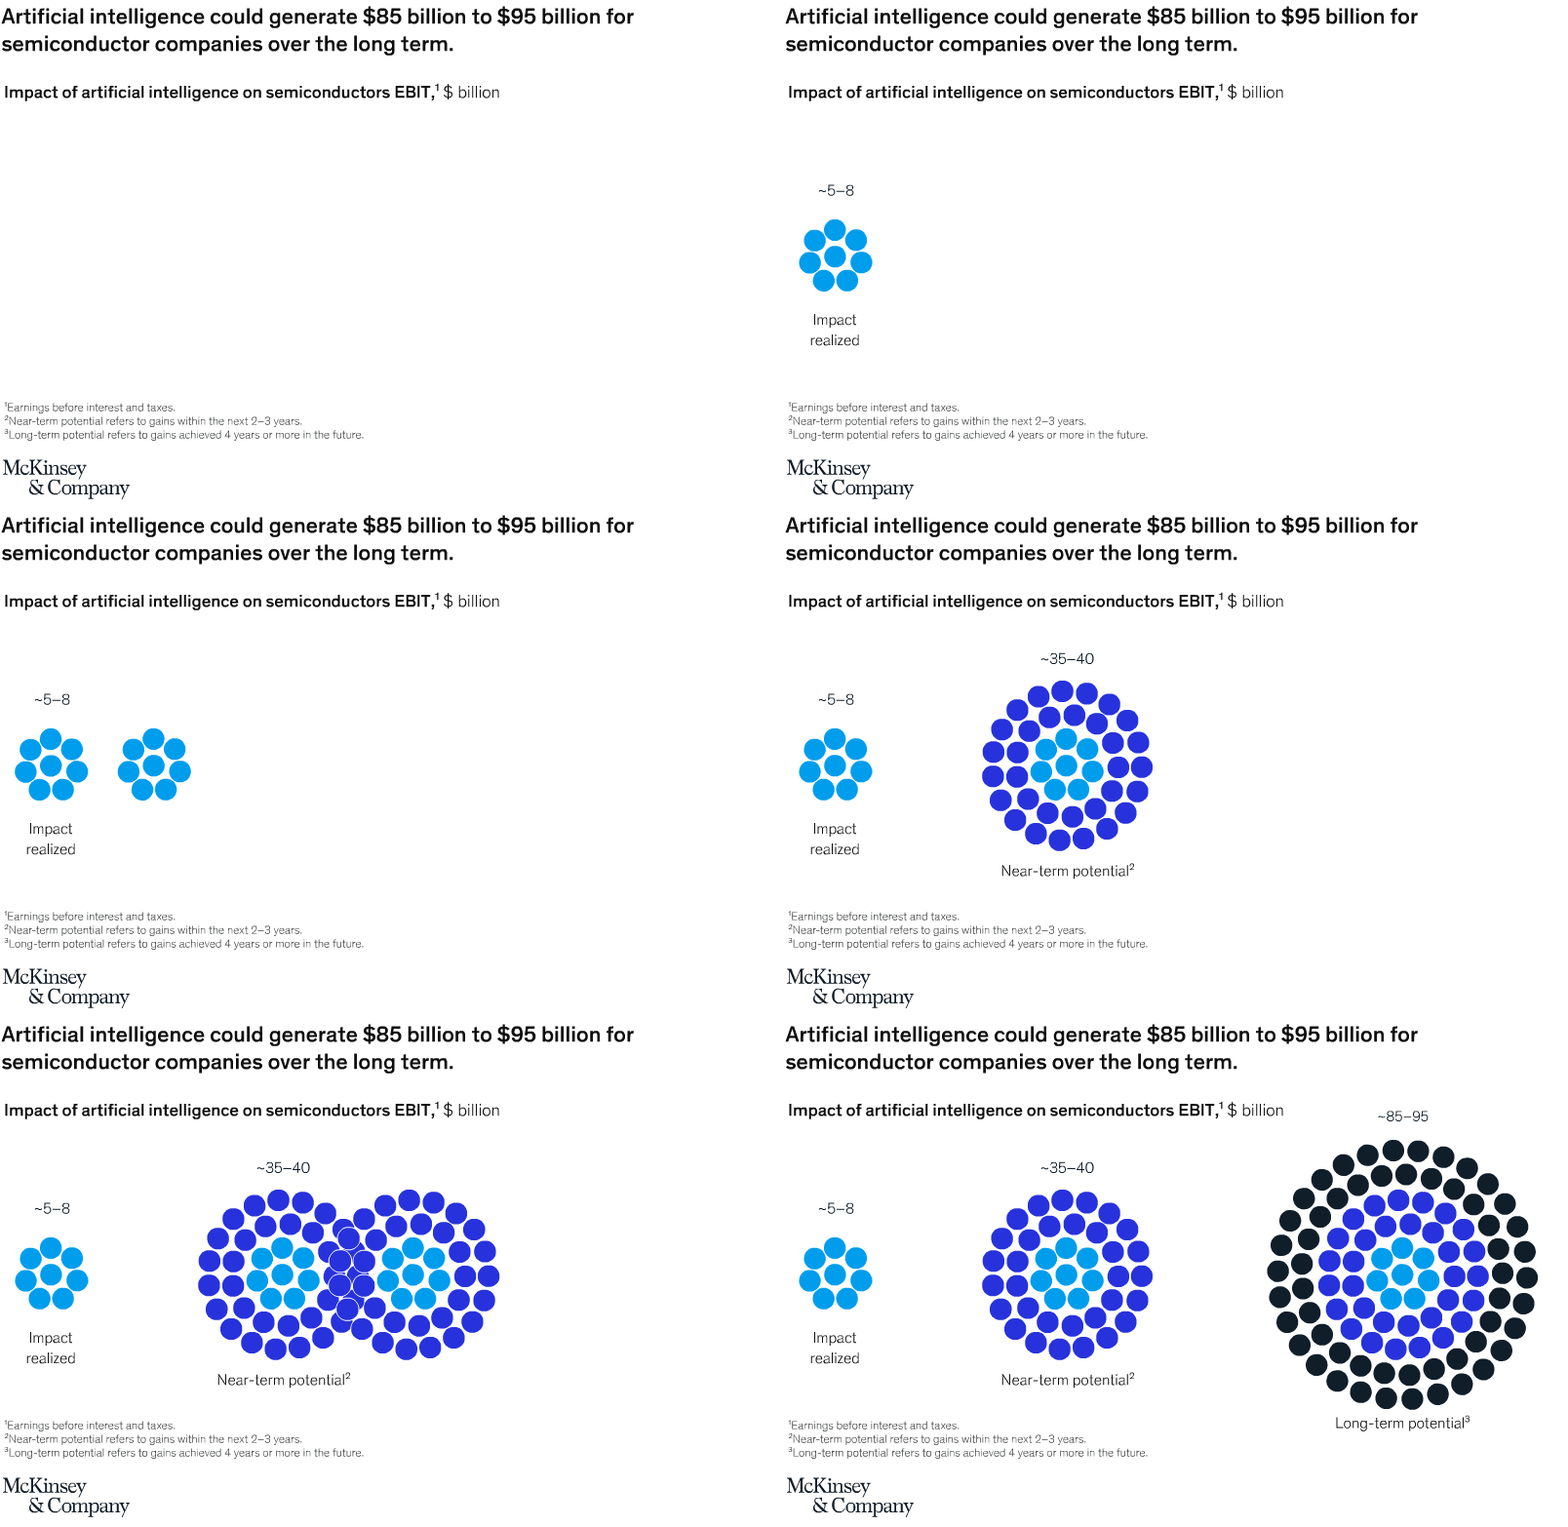
Three-panel dot-cluster comparison chart.
Layout / body structure
The chart lays out three circular dot clusters from left to right: impact realized, near-term potential, and long-term potential. Reader scans across the three clusters in that order while comparing how the total dot count expands as the value opportunity grows.
What is being compared
It compares the amount of EBIT impact artificial intelligence could generate for semiconductor companies across three time horizons: value already realized, near-term potential, and long-term potential.
Measurement system
The values are measured in billions of dollars of EBIT impact. Each cluster is labeled with an approximate range, and the growing number of dots scales the opportunity visually from the smallest realized pool to the largest long-term pool.
Visible structure inside the graphic
The realized cluster is a small group of light-blue dots, the near-term cluster adds a surrounding blue ring, and the long-term cluster expands into a much larger nested set with dark outer dots. That concentric buildup makes the widening opportunity legible even before the ranges are read closely.
Main takeaway from the visual
Semiconductor companies have realized only a small slice of the AI value available to them, with much larger gains still sitting in the near-term and especially the long-term horizon. The jump in cluster size from the first panel to the third makes the unrealized upside feel substantial.
Key standout values or extremes
The realized impact is shown at roughly 5 to 8 billion dollars, near-term potential at about 35 to 40 billion, and long-term potential at about 85 to 95 billion. The long-term cluster is by far the largest visual object on the page, underscoring how much bigger the later-stage upside is than the value already captured.
Controls / sequence, when applicable
This is a static chart image with no in-chart controls to operate.
Companion media, when applicable
There is no separate companion audio or video; the chart image is the full visual on this page.