Source page: McKinsey & Company
Commentary
European football clubs create higher value when they invest more in their current players than in new ones
Sports | Strategy | Europe
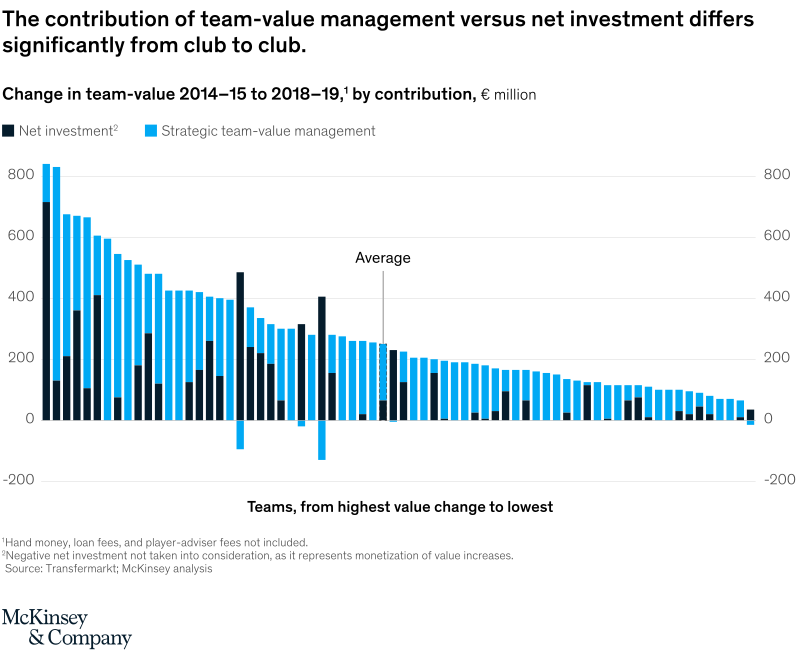
October 30, 2020 – Looking at the 69 most valuable European football clubs over the past five years, we’ve found that they can increase their financial value by developing their current players or investing in new ones. More than 70 percent of the clubs gained more value from developing existing players (or using strategic “team-value management”).
To read the article, see “The value pitch: The importance of team value management,” September 3, 2020.
customizer here
Visual form
Club-by-club scatter plot.
Layout / body structure
The chart is a single two-axis chart. Read it by locating each club marker against the horizontal net-investment dimension and the vertical team-value-management dimension, then scan the labeled regions that separate the different strategic approaches.
What is being compared
The chart compares European football clubs by two ways of building squad value over the past five years: value created through team-value management for current players versus value created through net investment in new players.
Measurement system
Both directions represent contribution to team-value growth, with the two axes separating value gained from management decisions and value gained from fresh transfer spending. The page text supplies the main population size of 69 clubs and the headline share of clubs that leaned more on team-value management.
Visible structure inside the graphic
Each plotted point stands for a club. The plot area is split into labeled zones, so the eye can distinguish clubs that rely mainly on internal player development and trading from those that rely more heavily on new-player investment.
Main takeaway from the visual
Most of the club markers fall on the side where team-value management contributes more than net investment, so the chart makes player development and value management look like the dominant route to value creation rather than simply spending more on transfers.
Key standout values or extremes
The clearest numeric anchor on the page is that more than 70 percent of the 69 clubs gained more value from team-value management than from investing extra money in new players. The strongest visual contrast is between the clubs clustered in the management-heavier regions and the smaller set pushed farther toward the net-investment side.
Controls / sequence, when applicable
This is a static chart image with no in-chart controls to operate.
Companion media, when applicable
There is no separate companion audio or video; the chart image is the full visual on this page.