Source page: McKinsey & Company
Commentary
Europeans earning and saving more
Consumer | Europe | Retail
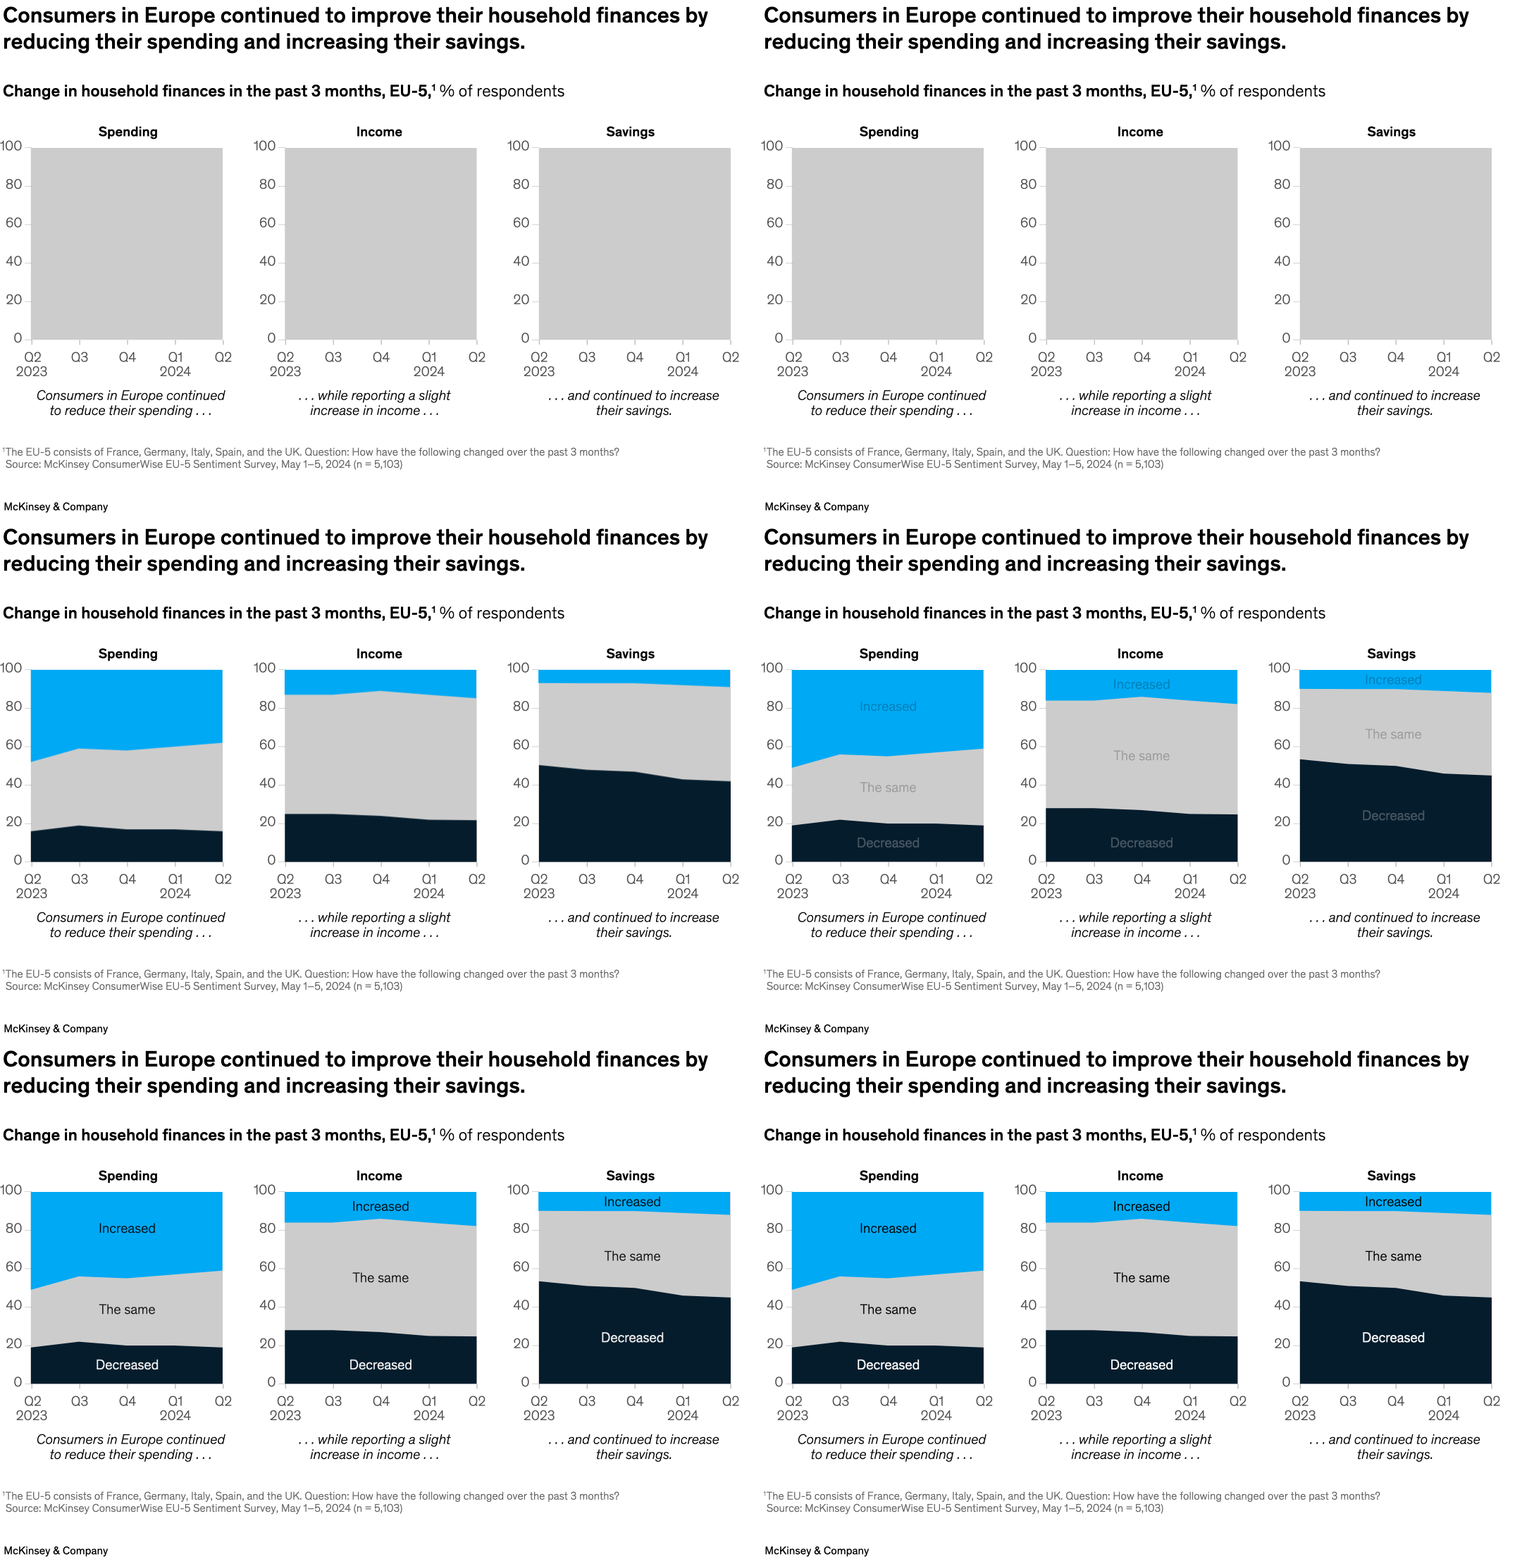
July 17, 2024 – European consumers continue to have mixed feelings about the economy and are increasing their savings. Based on a recent survey, senior partner Jessica Moulton and coauthors note that consumers in Europe are also reporting increased income and reduced spending in the past quarter. Nearly 30 percent of respondents indicate they’ve begun more carefully tracking their expenses to boost their savings.
To read the article, see “An update on European consumer sentiment: A sunnier outlook ahead of summer?,” June 21, 2024.
customizer here
Visual form
Three-panel stacked area comparison.
Layout / body structure
The page presents three side-by-side panels for spending, income, and savings, each read left to right from Q2 2023 to Q2 2024 with the same 0 to 100 percent scale and the same three response bands stacked vertically.
What is being compared
It compares how EU-5 consumers report changes in spending, income, and savings over the past three months.
Measurement system
Each panel is measured as a percent of respondents, and each stack is divided into increased, the same, and decreased so the composition of responses can be compared over time.
Visible structure inside the graphic
Every panel uses a stacked band layout with a dark bottom segment for decreased, a gray middle segment for the same, and a bright blue top segment for increased, with the shapes moving subtly over the five quarterly points.
Main takeaway from the visual
The chart shows household finances improving through restraint rather than a spending boom: reduced spending remains common, reported income edges up only slightly, and savings stay elevated and continue to build.
Key standout values or extremes
In the savings panel, the decreased-savings band is the largest of the three categories throughout but still narrows from just above 50 percent to the mid-40s while the ‘the same’ band grows; the income panel stays dominated by ‘the same’ around the mid-50s, and the spending panel keeps a large increased-spending band near the low-40s but with a visible rise in the share saying spending decreased relative to the starting point.
Controls / sequence, when applicable
This is a static chart image with no in-chart controls to operate.
Companion media, when applicable
There is no separate companion audio or video; the chart image is the full visual on this page.