Source page: McKinsey & Company
Commentary
Exploring export controls
Global Trade | Geopolitics | Semiconductors
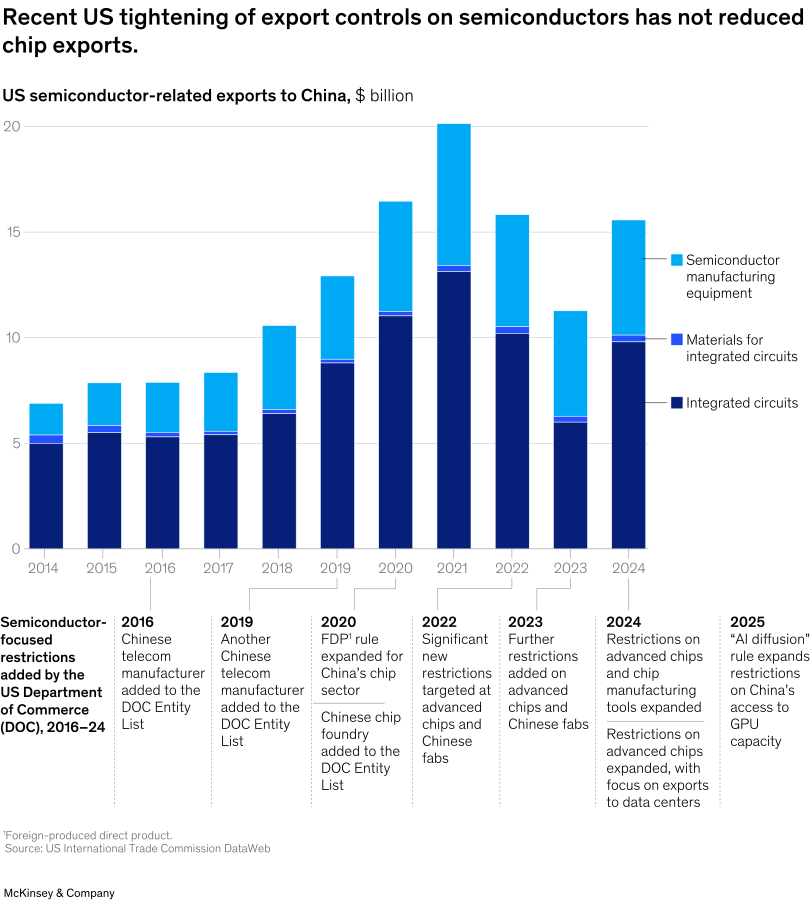
May 1, 2025 – Amid ongoing global geopolitical tensions, some companies are looking to untangle complex export control restrictions. However, while import data and customs duties are often publicly available, information on export controls is less accessible, and export control trends are tougher to analyze, Senior Partner Shubham Singhal and coauthors explain. For instance, US chip exports to China were expected to decline significantly after the United States in 2022 imposed greater controls on semiconductor exports to China. But the controls targeted a narrow subset of chips and manufacturing tools, and there has been no noticeable impact on market trends after two years.
To read the article, see “Restricted: How export controls are reshaping markets,” April 3, 2025.
customizer here
Visual form
Stacked time-series bar chart with a restriction timeline below. The chart combines annual export values with a second band that records the sequence of US Commerce Department restrictions.
Layout / body structure
The chart is arranged in two layers: a top run of annual stacked bars from 2014 through 2024 and a lower annotation timeline that lists major semiconductor-focused restrictions from 2016 through 2025. The reading path is left to right across the bars and then down through the dated policy events.
What is being compared
The visual compares US semiconductor-related exports to China over time across integrated circuits, materials for integrated circuits, and semiconductor manufacturing equipment. It also compares those export levels against the timing of the restrictions added by the US Department of Commerce.
Measurement system
The bars are measured in billions of dollars. Color separates the three export categories, and the lower timeline uses years and text annotations rather than numeric axes to show when restriction changes occurred.
Visible structure inside the graphic
Each year is shown as a stacked column with a dark base for integrated circuits, a very thin middle strip for materials for integrated circuits, and a lighter top segment for semiconductor manufacturing equipment. Under the bars, boxed or bracketed notes mark important regulatory moments in 2016, 2019, 2020, 2022, 2023, 2024, and 2025, making the chart read as a paired market-and-policy timeline.
Main takeaway from the visual
The visible takeaway is that tighter export controls did not cause a simple collapse in semiconductor-related exports to China. Exports rose strongly into 2021, remained well above early-period levels afterward, and the policy timeline shows repeated tightening without a matching sustained breakdown in the trade pattern.
Key standout values or extremes
The total rises from roughly 7 billion dollars in 2014 to just over 20 billion in 2021, then settles around the mid-teens in 2022 to 2024. The 2024 bar remains clearly above pre-2018 levels, and the timeline highlights a dense run of restrictions in 2022, 2023, 2024, and 2025 rather than one isolated policy event.
Controls / sequence, when applicable
This is a static chart image with no in-chart controls to operate.
Companion media, when applicable
There is no separate companion audio or video; the chart image is the full visual on this page.