Source page: McKinsey & Company
Commentary
Exploring options in insurance investing
Private equity | Investing | Financial services
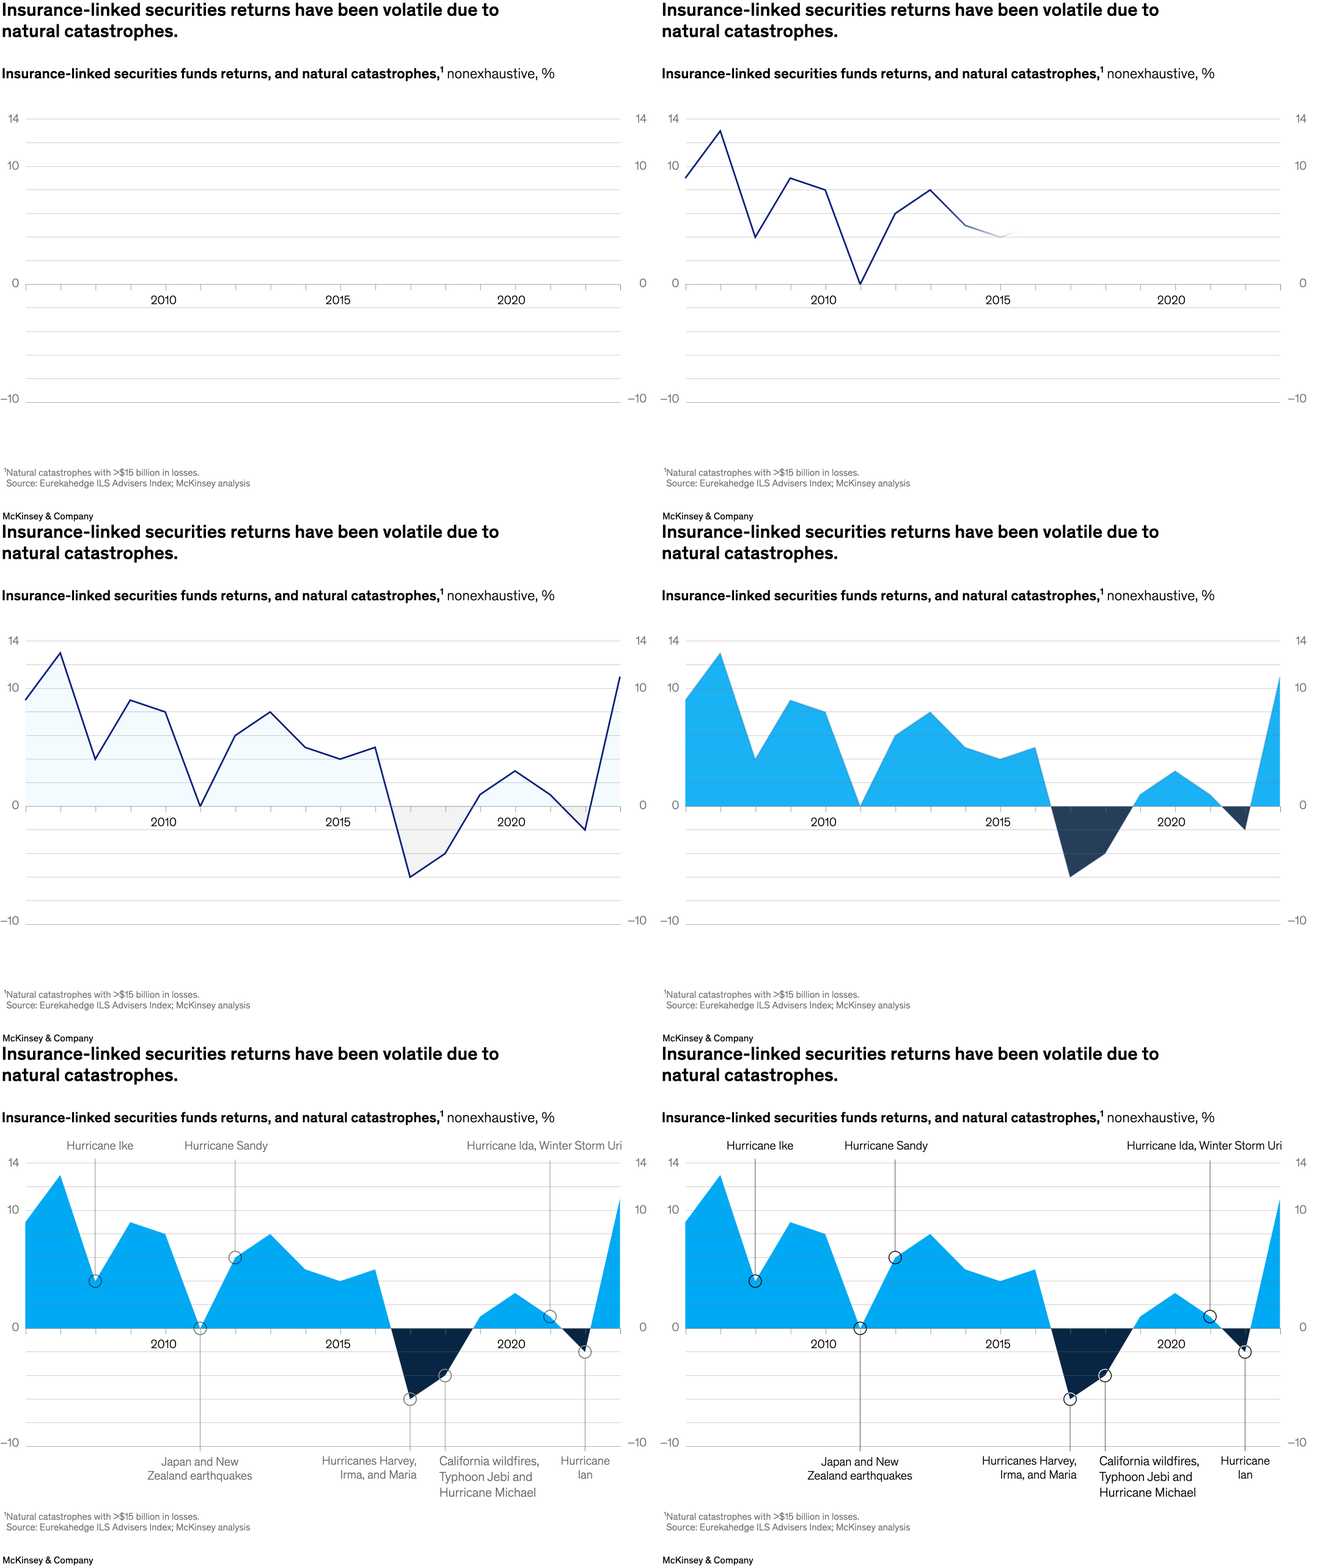
December 4, 2023 – The role of private equity (PE) in the insurance sector is quickly evolving. For example, PE-backed insurers and other investors have turned to alternative-capital solutions such as insurance-linked securities (ILS). Partner Grier Tumas Dienstag and colleagues find that investors injected about $20 billion into ILS In 2021; 2023 could exceed that number. However, these securities have shown mixed results, due in part to an uptick in extreme weather events, with returns ranging from –6 to 11 percent from 2017 to 2023.
To read the article, see “Insurance investors: Priorities and opportunities,” October 30, 2023.
customizer here
Visual form
Filled line chart with event markers. The visual tracks insurance-linked-securities returns over time and annotates major catastrophe periods directly on the timeline.
Layout / body structure
The chart is presented as one long horizontal time series. Reader moves left to right through the return path, using the labeled disaster markers as reference points for why the line rises sharply in some periods and falls below zero in others.
What is being compared
The visual compares annualized insurance-linked-securities fund returns across time against the occurrence of major natural-catastrophe events. It is essentially showing how one financial-return series behaves when catastrophe-heavy periods interrupt the market.
Measurement system
The vertical scale is percentage return, with zero as the dividing line between positive and negative territory. The horizontal axis is time, and the event labels anchor the return swings to named catastrophe periods rather than to abstract dates alone.
Visible structure inside the graphic
The chart uses a blue filled area above zero, darker negative dips below zero, and circular or labeled markers where major hurricanes or other catastrophe events are identified. This structure makes the volatility easy to read because the fill expands in good periods and drops sharply around the annotated loss events.
Main takeaway from the visual
Returns in insurance-linked securities can be attractive, but they are highly exposed to catastrophe-driven shocks. The chart makes that trade-off visible by alternating strong positive peaks with sudden drawdowns around hurricane-heavy periods and then showing a rebound afterward.
Key standout values or extremes
The series reaches into the low teens on the upside and falls to around the negative mid-single digits after some of the most severe catastrophe clusters. The final point rebounds to roughly 10 percent, while the source range notes that returns from 2017 to 2023 ranged from negative 6 percent to positive 11 percent.
Controls / sequence, when applicable
This is a static chart image with no in-chart controls to operate.
Companion media, when applicable
There is no separate companion audio or video; the chart image is the full visual on this page.