Source page: McKinsey & Company
Commentary
Facing onerous debts, US college grads appear to be increasingly questioning the value of their education
Education | North America
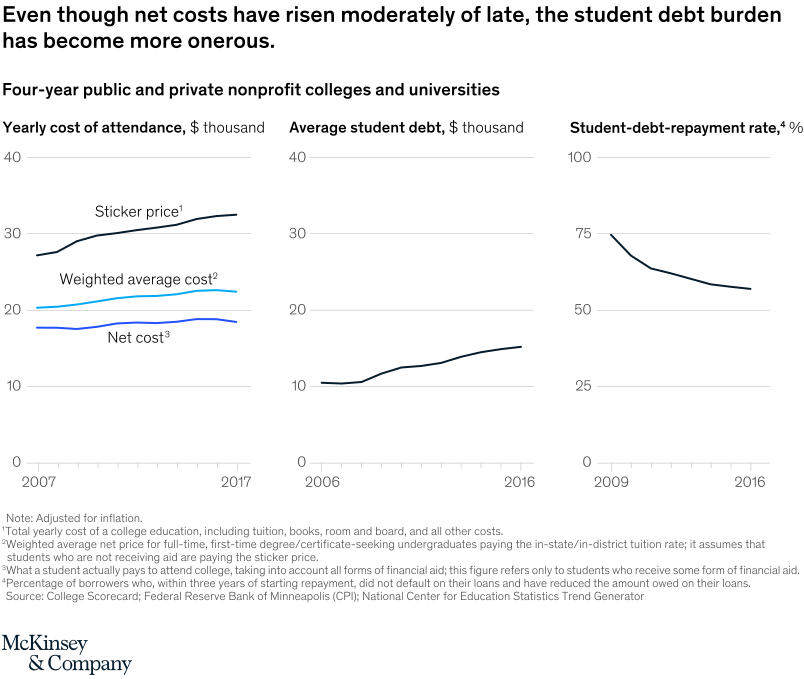
October 29, 2020 – For students who receive financial aid, the net cost of college hadn’t risen too much in the decade leading up to 2017. But average student debt rose 45 percent, and repayment rates dropped by 24 percent.
To read the article, see “Reimagining higher education in the United States,” October 26, 2020.
customizer here
Visual form
Three-series time-line comparison chart.
Layout / body structure
The chart is a single chart on a shared timeline leading up to 2017. Read it left to right across the years and then compare how far apart the three series finish from one another by the end of the period.
What is being compared
The chart compares three higher-education affordability measures: yearly cost of attendance, average student debt, and repayment performance for student borrowers.
Measurement system
The reader tracks relative change over time rather than raw dollar amounts alone. The headline labels anchor the main movements: attendance cost rises only moderately, average student debt climbs sharply, and repayment rates move downward.
Visible structure inside the graphic
Three differently colored series share the same horizontal year axis. One series stays comparatively restrained, one rises much more steeply, and one trends downward, so the gap among cost, debt, and repayment becomes wider as the chart moves toward the right edge.
Main takeaway from the visual
The picture argues that the pressure on graduates is coming less from a runaway rise in the annual cost of attendance and more from the combination of much heavier debt loads and weaker repayment outcomes.
Key standout values or extremes
The strongest visible endpoints are the 45 percent rise in average student debt and the 24 percent drop in repayment rates, while the cost-of-attendance line is described as having risen only moderately over the same stretch.
Controls / sequence, when applicable
This is a static chart image with no in-chart controls to operate.
Companion media, when applicable
There is no separate companion audio or video; the chart image is the full visual on this page.