Source page: McKinsey & Company
Commentary
Fashion’s emission outliers
Decarbonization | Retail
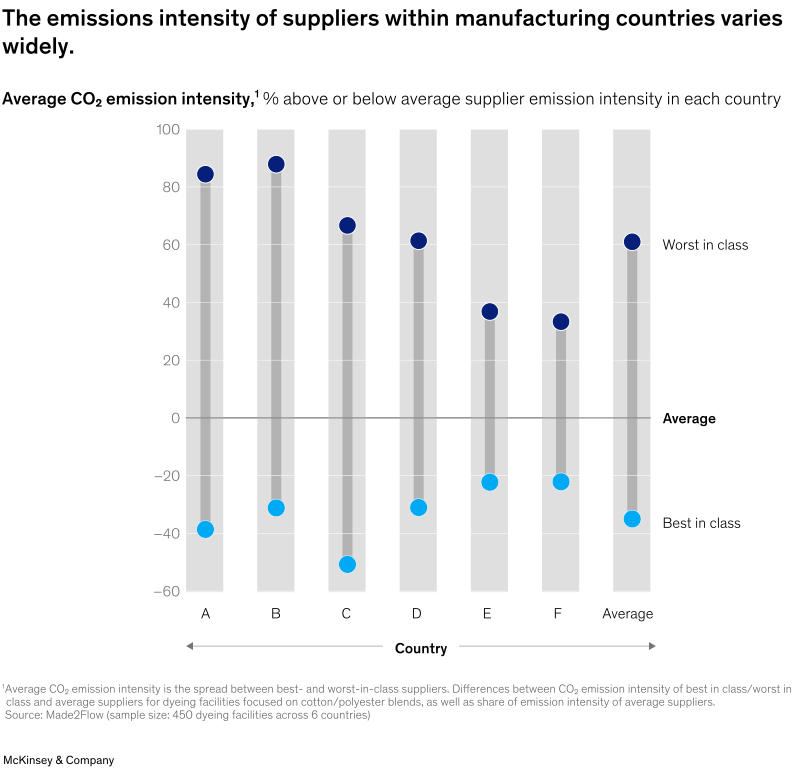
April 24, 2025 – In the fashion industry, Tier 2 suppliers play a crucial role in the production process, focusing on the creation and treatment of fabrics before they are assembled by Tier 1 suppliers. The CO2 emissions intensity of Tier 2 suppliers can vary significantly, both across different countries and within the same country, as explained by Partner Robert Westerdahl and colleagues. For example, in one country, the best-in-class manufacturers have managed to reduce their emissions by 39 percent compared with the national average, while the worst-in-class manufacturers have seen their emissions increase by 84 percent.
To read the article, see “Sustainable style: How fashion can reduce Tier 2 emissions,” March 18, 2025.
customizer here
Visual form
Scatter Plot: country-by-country emissions-intensity range plot with best-in-class and worst-in-class markers.
Layout / body structure
Countries A through F and the overall average are arranged as vertical lanes. Each lane places a lower marker for the best-in-class supplier and an upper marker for the worst-in-class supplier around the zero-average reference line.
What is being compared
It compares how far Tier 2 fashion suppliers in each country sit above or below their national average emissions intensity.
Measurement system
Values are percent difference from the average supplier emissions intensity in that country. Zero marks the country average, negative values show better-than-average suppliers, and positive values show worse-than-average suppliers.
Visible structure inside the graphic
Each lane has two dots separated vertically, turning the country into a visible spread around the average. The upper dark markers show worst-in-class outliers, and the lower blue markers show best-in-class performance.
Main takeaway from the visual
The chart shows large emissions-intensity differences within countries, meaning supplier selection can matter as much as country selection for reducing fashion supply-chain emissions.
Key standout values or extremes
Country A spans from about 39 percent below average to about 84 percent above average, and country B spans from about 31 percent below to about 88 percent above. The overall average lane runs from about 35 percent below to about 61 percent above.
Controls / sequence, when applicable
This is a fixed range-style scatter plot; there are no in-chart controls to operate.
Companion media, when applicable
There is no separate companion audio or video; the supplier emissions-intensity range plot is the visual on this page.