Source page: McKinsey & Company
Commentary
Feeling glum? You’re not alone
Consumer | Inflation
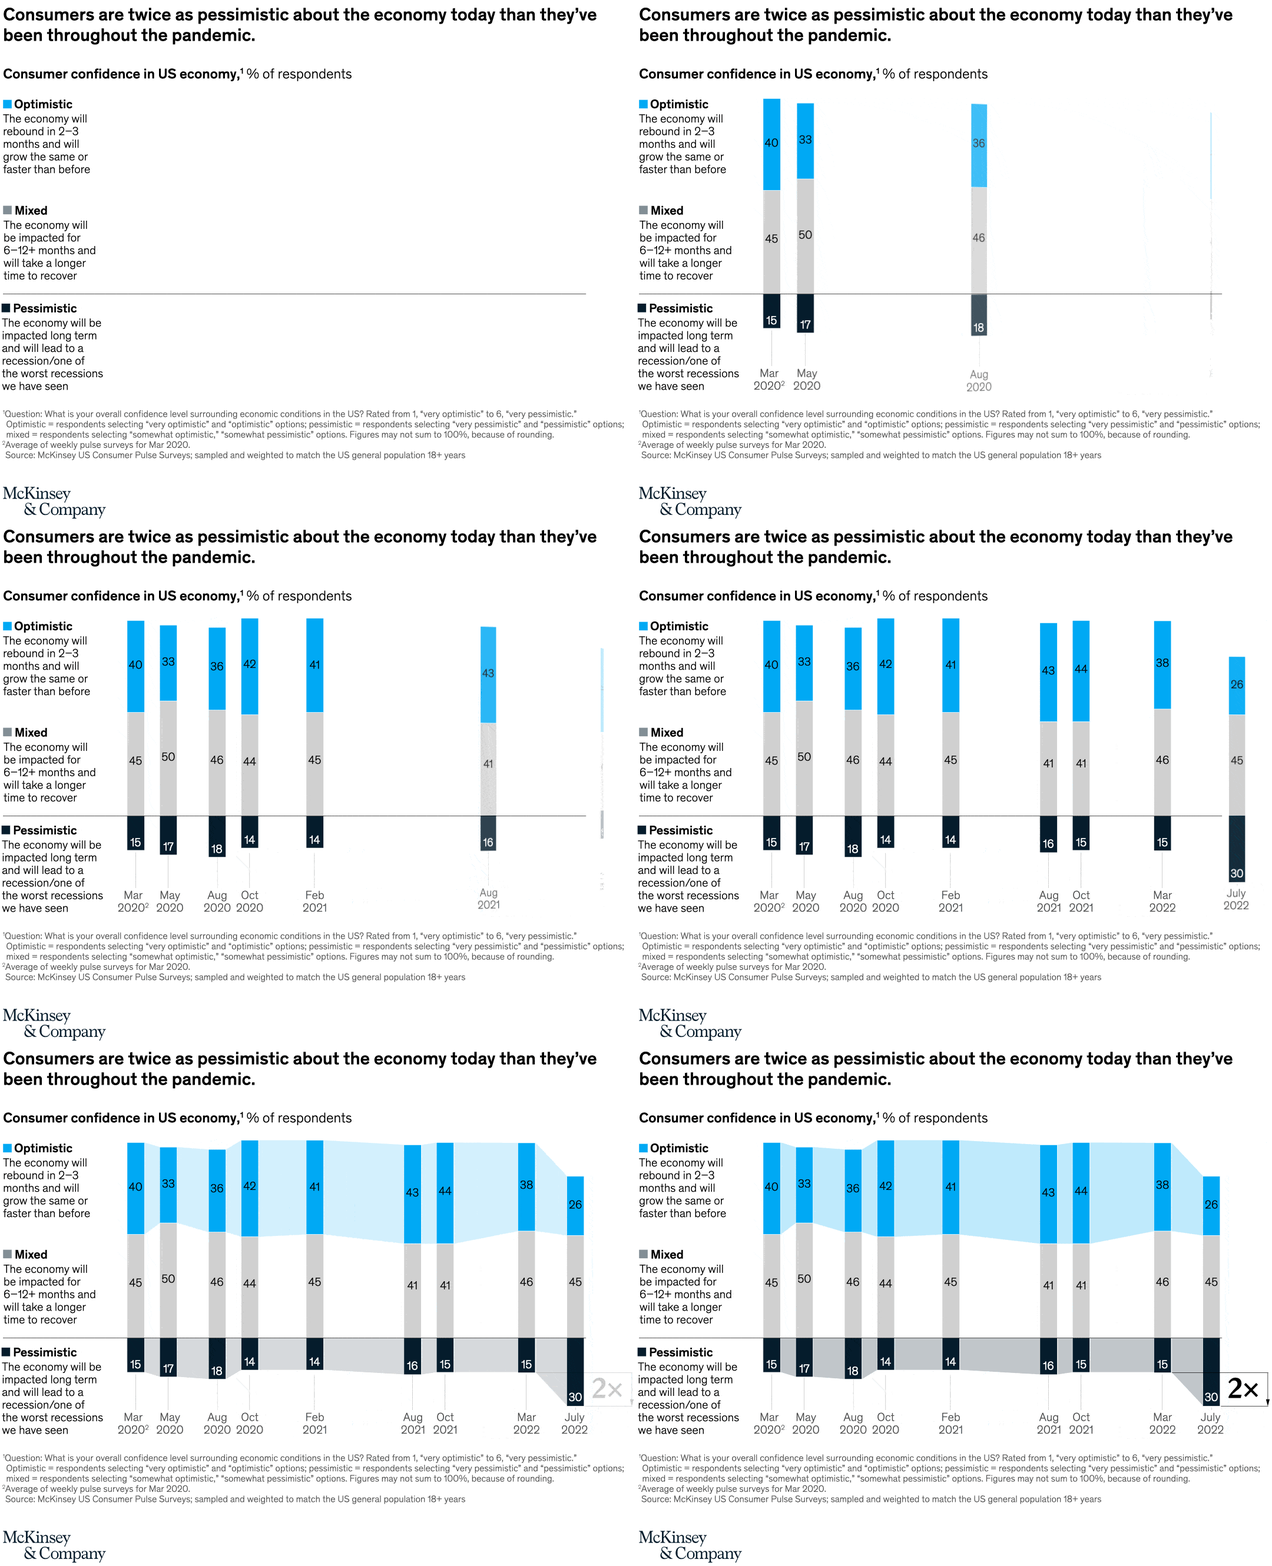
August 30, 2022 – Inflation is the highest it’s been in decades, and many consumers are worried. Take the United States: according to our latest Consumer Pulse Survey, which included perspectives from more than 4,000 adults in the US, 30 percent of respondents now say they are feeling pessimistic about the country’s economy. That’s twice as many who expressed such sentiment than just a few months prior.
To read the article, see “The Great Uncertainty: US consumer confidence and behavior during inflationary times,” August 16, 2022.
customizer here
Visual form
A diverging 100 percent stacked column chart.
Layout / body structure
The graphic is a single time-series chart read left to right from March 2020 to March 2022. A text legend on the left defines the three sentiment bands, the columns sit in the middle of the page, and a horizontal baseline separates the pessimistic segment below from the mixed and optimistic segments above.
What is being compared
The chart compares US consumer confidence readings across eight survey points during and after the pandemic. At each time point it splits respondents into optimistic, mixed, and pessimistic views of the economy.
Measurement system
The measurement is percentage of respondents. Each column totals roughly 100 percent, with blue showing optimistic responses, gray showing mixed responses, and the dark segment below the baseline showing pessimistic responses.
Visible structure inside the graphic
There are eight stacked columns labeled Mar 2020, May 2020, Aug 2020, Oct 2020, Feb 2021, Aug 2021, Oct 2021, and Mar 2022. Each column carries the segment values inside the bars, so the reader can see the optimistic share at the top, the mixed share in the middle, and the pessimistic share dropping below the center line.
Main takeaway from the visual
The visual shows pessimism staying relatively contained through most of the pandemic and then jumping back up by March 2022 while optimism fades. The rightmost column makes that reversal easy to see because the optimistic segment shrinks and the pessimistic block expands back to the same 15 percent level seen at the start of the series.
Key standout values or extremes
The standout values are the rise in pessimism from 14 percent in February 2021 to 15 percent in March 2022 after sitting as low as 14 and 15 during 2020 and 2021, alongside optimism sliding from 44 percent in October 2021 to 38 percent in March 2022. The mixed share also climbs back to 46 percent in March 2022, matching the elevated middle band seen earlier in the series.
Controls / sequence, when applicable
This is a static chart image with no in-chart controls to operate.
Companion media, when applicable
There is no separate companion audio or video; the chart image is the full visual on this page.