Source page: McKinsey & Company
Commentary
Finding fixes for chronic disease
Healthcare | Life Sciences | Digital
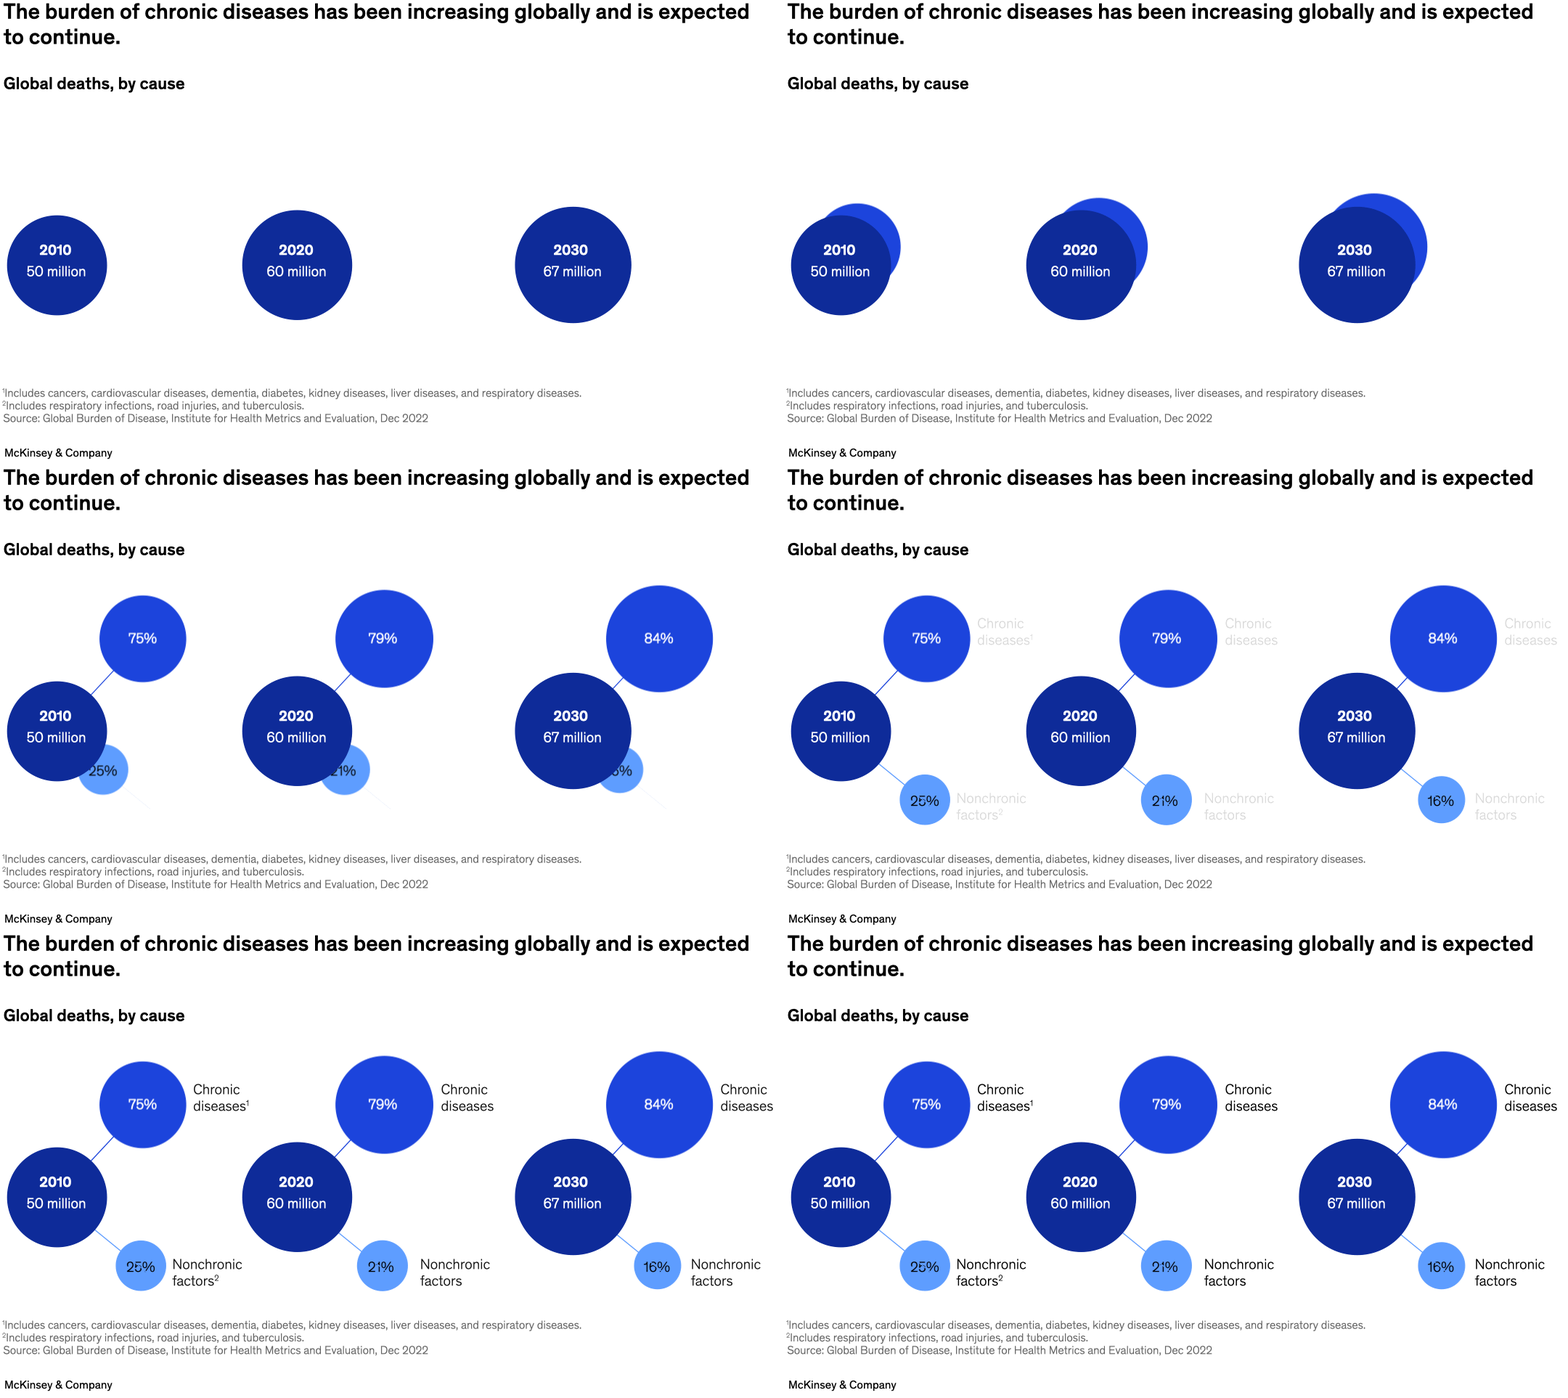
February 24, 2023 – Chronic diseases are expected to create an increased burden globally, find senior partner Ralf Dreischmeier and coauthors. Conditions such as cardiovascular disease, cancer, diabetes, and respiratory disease were causes or contributing factors in 75 percent of worldwide deaths in 2010 and 79 percent in 2020. By 2030, experts predict that percentage could grow to as much as 84 percent. Digital therapeutics, such as regular monitoring through connected medical devices, could help with disease management.
To read the article, see “The health benefits and business potential of digital therapeutics,” January 27, 2023.
customizer here
Visual form
Bubble sequence chart.
Layout / body structure
The page is arranged as three time snapshots for 2010, 2020, and 2030, each using a large dark bubble for total deaths and two connected smaller bubbles for chronic and nonchronic causes.
What is being compared
It compares the total number of global deaths across three years and the share of those deaths attributable to chronic versus nonchronic causes.
Measurement system
The main values are total deaths in millions, and the shares for chronic and nonchronic causes are shown as percentages in the attached bubbles.
Visible structure inside the graphic
Each year is represented by one large main circle labeled with the total deaths, with two smaller offset circles connected to it. The chronic-disease share is shown in the larger of the attached circles and grows over time, while the nonchronic share contracts in the smaller companion bubble.
Main takeaway from the visual
The visual shows both total deaths rising and the chronic share of those deaths becoming more dominant over time, so the burden grows in absolute terms and also takes up a larger share of overall mortality.
Key standout values or extremes
Total deaths rise from 50 million in 2010 to 60 million in 2020 and 67 million in 2030. The chronic-disease share rises from 75 percent to 79 percent and then 84 percent, while the nonchronic share falls from 25 percent to 21 percent and then 16 percent.
Controls / sequence, when applicable
This is a static chart image with no in-chart controls to operate.
Companion media, when applicable
There is no separate companion audio or video; the chart image is the full visual on this page.