Source page: McKinsey & Company
Commentary
Flights of fancy delivery
Aerospace | Innovation
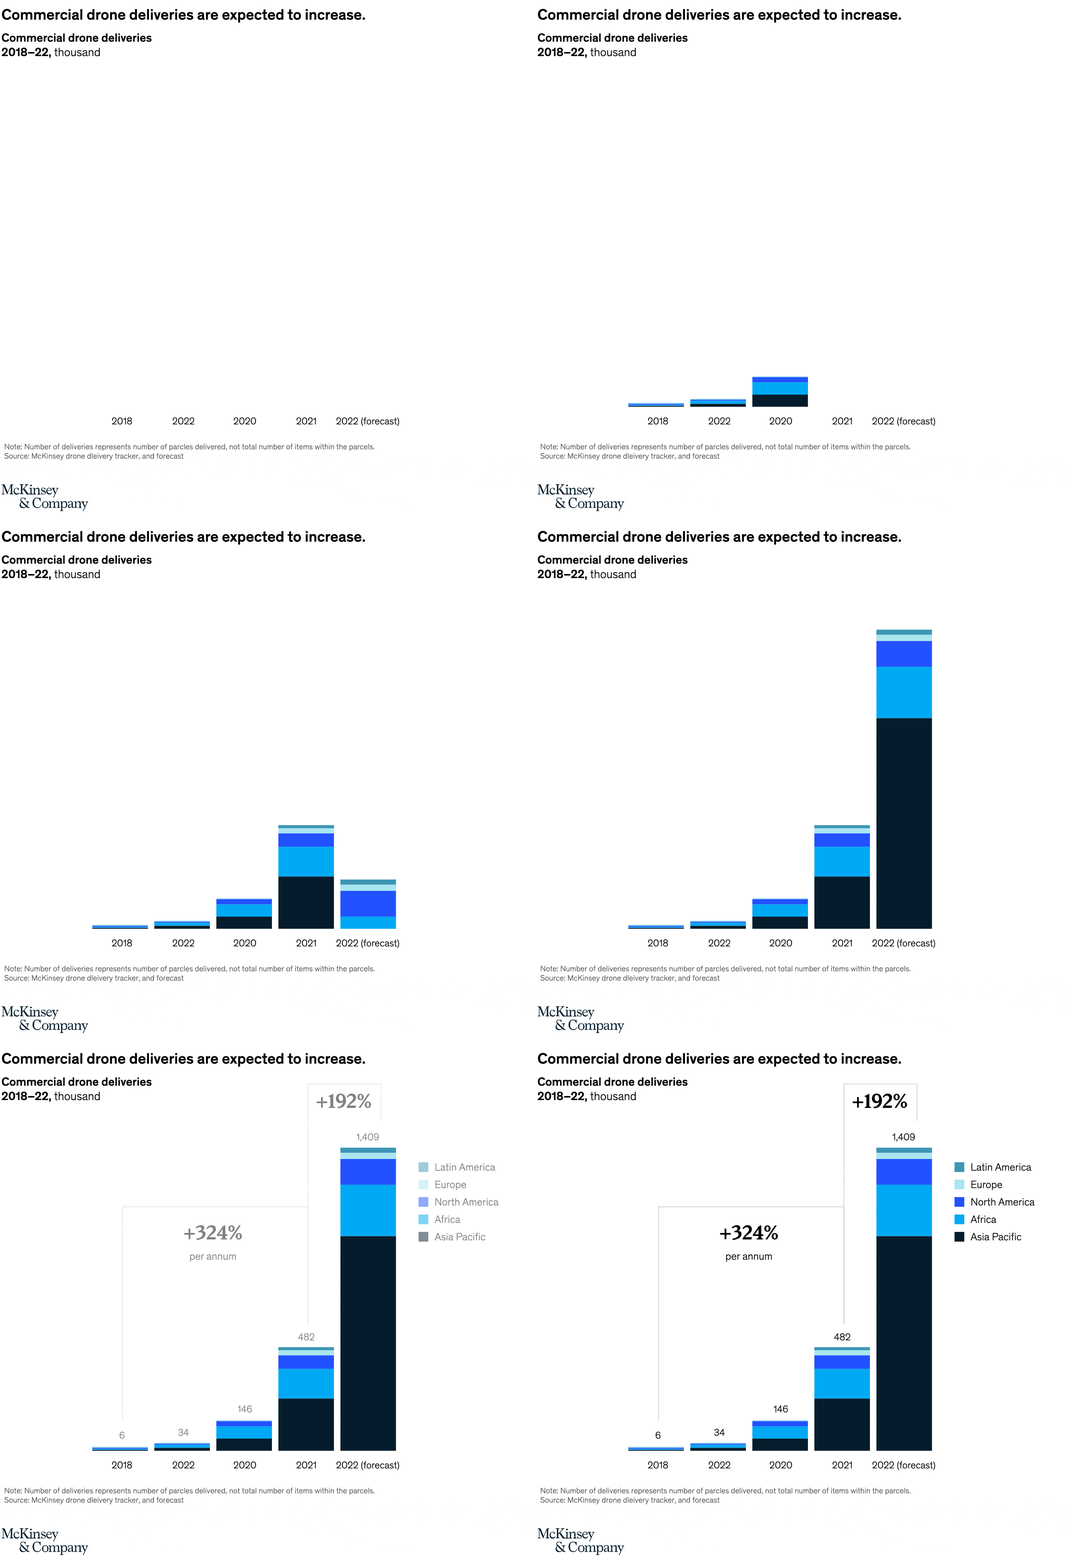
April 5, 2022 – Your next online order might be airborne. Commercial deliveries via drone topped 600,000 globally in the past three years. Experts predict there will be as many as 1.5 million drone deliveries in 2022, distributing everything from pizzas to medical supplies.
To read the article, see “Drone delivery: More lift than you think,” March 15, 2022.
customizer here
Visual form
Stacked-column growth chart.
Layout / body structure
The chart is a single sequence of annual stacked columns, with the smaller years on the left and the much taller forecast bar on the far right. Read left to right across the years to see the total rise, then use the color legend to compare how each region contributes to the later bars.
What is being compared
The chart compares commercial drone deliveries over time and by region. It contrasts Asia Pacific, Africa, North America, Europe, and Latin America within each annual total while also showing how the global total scales up from the earliest year to the 2022 forecast.
Measurement system
The vertical measure is commercial drone deliveries in thousands. Each column total is labeled directly above the stack, and the colored segments split that total by region rather than by product type.
Visible structure inside the graphic
The first bars are very short, then the stacks ramp up sharply through the middle of the sequence before culminating in a much taller forecast bar at the far right. Asia Pacific forms the largest dark base in the biggest bars, with Africa and North America adding the next most visible layers above it and Europe and Latin America appearing as thinner caps.
Main takeaway from the visual
Commercial drone deliveries are projected to rise extremely quickly, with the step from the latest observed year to the forecast year dominating the page. The dramatic height jump at the far right makes the market look like it is moving from experimentation into scaled deployment.
Key standout values or extremes
The totals shown on the bars rise from 6 and 34 in the earliest part of the series to 146, then 482, and finally 1,409 in the 2022 forecast. The callouts emphasize that this represents 324 percent per annum growth through the early ramp and a further 192 percent increase into the forecast year, with Asia Pacific visibly carrying the largest share of the final stacked total.
Controls / sequence, when applicable
This is a static chart image with no in-chart controls to operate.
Companion media, when applicable
There is no separate companion audio or video; the chart image is the full visual on this page.