Source page: McKinsey & Company
Commentary
Following the money for racial justice
Diversity & Inclusion | Inequality
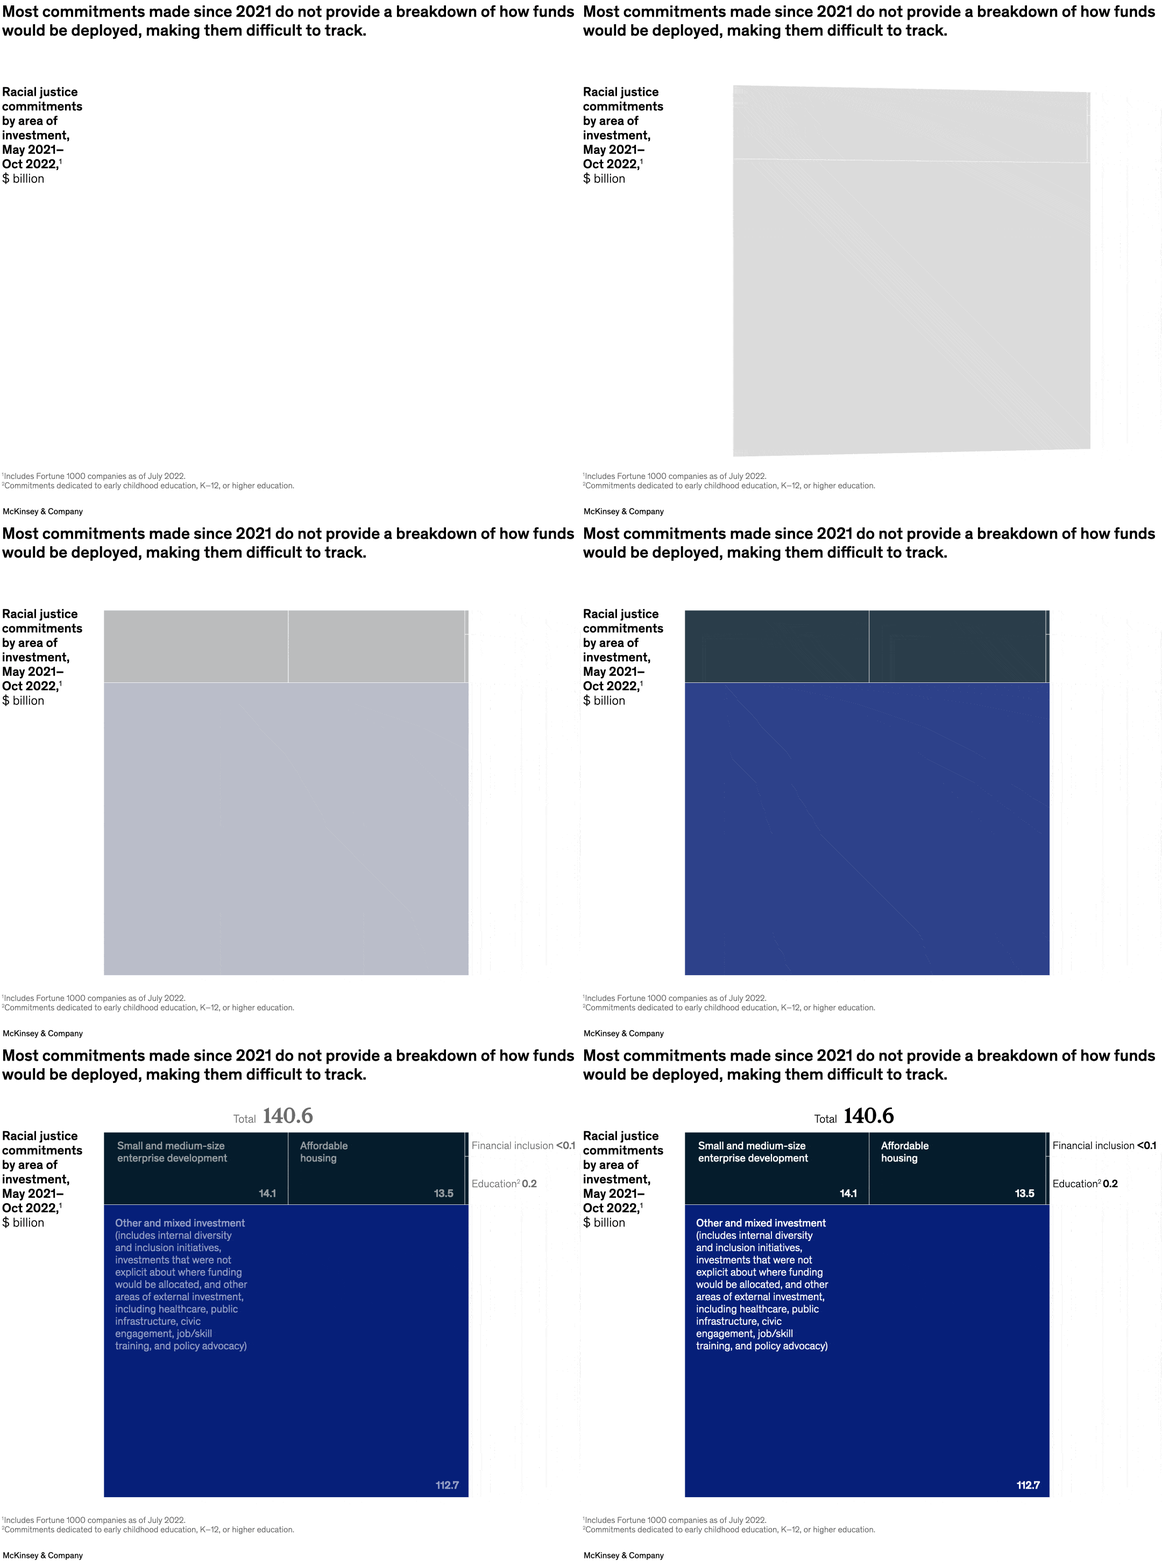
February 28, 2023 – Companies continue to pledge funding to fight racial injustice. But where is the money going? The answer is often unclear, find partner Duwain Pinder and colleagues. In a recent analysis of racial equity commitments from Fortune 1000 companies, more than $112 billion worth of commitments have been broader in scope, versus pledges dedicated to specific areas such as small and medium businesses and affordable housing. In some cases, companies donate to an initiative that pools funds, and the initiative leaders are then responsible for deploying the money.
To read the article, see “Corporate commitments to racial justice: An update,” February 21, 2023.
customizer here
Visual form
Treemap.
Layout / body structure
The visual is one large square divided into investment categories, so the page reads as an area comparison from the biggest funding bucket down to the smallest.
What is being compared
It compares racial-justice commitments by area of investment, including small and medium-size enterprise development, affordable housing, financial inclusion, education, and a broad other-and-mixed category.
Measurement system
The values are measured in billions of dollars, encoded by the relative area of each rectangle and reinforced by labels inside the blocks.
Visible structure inside the graphic
A very large dark-blue rectangle for other and mixed investment dominates the lower-left of the treemap, while smaller blocks for enterprise development and affordable housing sit along the top. Tiny slivers on the right edge represent financial inclusion and education, making them visibly minor shares of the total.
Main takeaway from the visual
Most of the committed money falls into broad or mixed categories that are harder to trace, while the clearly specified categories occupy much smaller areas. The visual makes the lack of granular deployment detail the main story.
Key standout values or extremes
The total is 140.6 billion dollars. Other and mixed investment accounts for 112.7 billion, small and medium-size enterprise development for 14.1 billion, affordable housing for 13.5 billion, education for 0.2 billion, and financial inclusion for less than 0.1 billion.
Controls / sequence, when applicable
This is a static chart image with no in-chart controls to operate.
Companion media, when applicable
There is no separate companion audio or video; the chart image is the full visual on this page.