Source page: McKinsey & Company
Commentary
For the fashion industry and fashionistas everywhere, less is the new more.
Retail | Sustainability
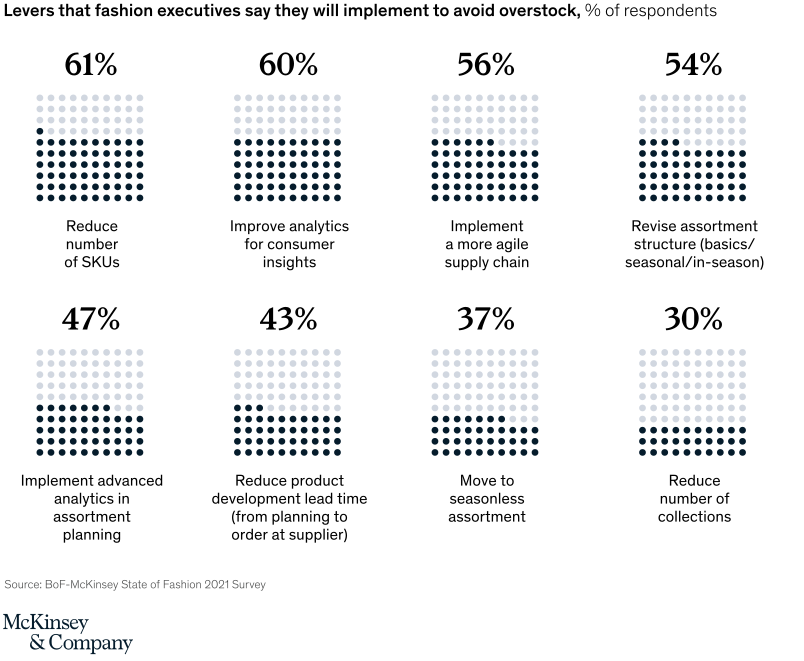
March 16, 2021 – To avoid excessive inventories and widespread markdowns—and in response to consumers’ shifting preferences to longer-lasting, sustainably produced goods—fashion companies are reducing the number of SKUs and implementing more agile supply chains.
To read the article, see “Five charts that set the tone as New York Fashion Week 2021 kicks off,” February 12, 2021.
customizer here
Visual form
Eight-panel dot-matrix comparison chart.
Layout / body structure
The chart is arranged as two rows of four 10-by-10 dot grids, with a percentage above each grid and a short lever label underneath. Reader moves left to right across the top row and then left to right across the bottom row to compare the full menu of overstock-reduction levers.
What is being compared
It compares the share of fashion executives who say they will implement each of eight actions to avoid overstock, including SKU reduction, analytics improvements, a more agile supply chain, assortment revision, advanced assortment analytics, shorter product-development lead times, seasonless assortment, and reducing the number of collections.
Measurement system
The measure is percent of respondents. Each panel works like a 100-dot icon array, with dark filled dots representing the selected share and pale dots representing the remainder, while the exact percentage is printed above each grid.
Visible structure inside the graphic
Every lever gets its own identical dot matrix, so the comparison depends on how full each grid looks rather than on changing axes. The most favored actions sit as fuller grids in the top row, while the least favored actions leave noticeably more pale dots in the bottom row.
Main takeaway from the visual
Fashion executives cluster around cutting complexity and improving planning rather than around preserving the old merchandising cadence. The fullest grids belong to reducing SKUs, improving consumer-insight analytics, and implementing a more agile supply chain, while reducing the number of collections is visibly the weakest option.
Key standout values or extremes
The highest shares are reducing the number of SKUs at 61 percent, improving analytics for consumer insights at 60 percent, implementing a more agile supply chain at 56 percent, and revising assortment structure at 54 percent. The lowest shares are moving to seasonless assortment at 37 percent and reducing the number of collections at 30 percent, with advanced assortment analytics at 47 percent and shorter product-development lead times at 43 percent in between.
Controls / sequence, when applicable
This is a static chart image with no in-chart controls to operate.
Companion media, when applicable
There is no separate companion audio or video; the chart image is the full visual on this page.