Source page: McKinsey & Company
Commentary
Four essentials for hybrid work
COVID-19 | Future of Work | Hybrid work
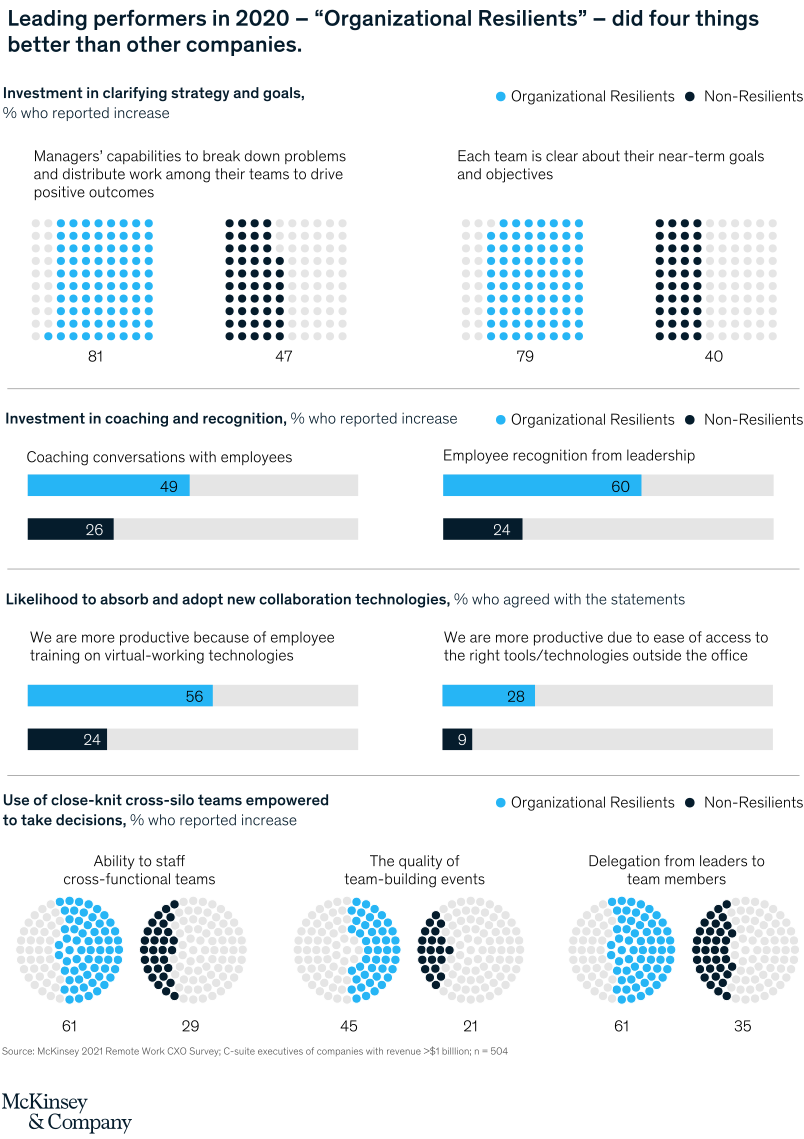
August 3, 2021 – During the pandemic, about 50 percent of the companies in our dataset increased performance, while the rest saw no meaningful change or decreases. The top performers were also more likely to see performance gains across the board and not just for some teams. The most productive even witnessed a 48-percent increase in employees’ job satisfaction. We call the top performers “Organizational Resilients.” They did four things differently during the pandemic.
To read the article, see “Return as a muscle: How lessons from COVID-19 can shape a robust operating model for hybrid and beyond,” July 9, 2021.
customizer here
Visual form
Multi-panel dashboard chart combining dot matrices, horizontal bars, and semicircle dot arrays.
Layout / body structure
The chart is stacked as four sections from top to bottom, each focused on one capability area. Read each section left to right within its row, then move down through strategy and goals, coaching and recognition, collaboration technologies, and close-knit cross-silo teams.
What is being compared
Across all four sections, the chart compares organizational resilients with non-resilients on practices linked to hybrid work and performance. It contrasts the two groups on goal clarity, coaching and recognition, technology adoption, and team design or delegation.
Measurement system
Every comparison is shown as a percent who reported increase or agreed with a statement. Light blue denotes organizational resilients and dark navy denotes non-resilients, with values printed directly on the marks in each section.
Visible structure inside the graphic
The top row uses two side-by-side dot matrices for strategy and goals. The middle two rows use paired horizontal bars for coaching conversations, employee recognition, and two technology-adoption statements. The bottom row switches to three paired semicircle dot arrays for cross-functional staffing, team-building quality, and delegation from leaders to team members, making the page read like one dashboard of repeated side-by-side comparisons.
Main takeaway from the visual
Organizational resilients outperform non-resilients in every block on the page, and the gap repeats so consistently that no section breaks the pattern. The visual signal is strongest in the first row and in the lower rows where the blue marks are often roughly double or more than the dark comparison marks.
Key standout values or extremes
On strategy and goals, resilients score 81 versus 47 and 79 versus 40. In coaching and recognition, they post 49 versus 26 and 60 versus 24. In technology adoption, they reach 56 versus 24 and 28 versus 9. In the cross-silo team section, they post 61 versus 29, 45 versus 21, and 61 versus 35. The widest visible gap is 36 points on employee recognition from leadership.
Controls / sequence, when applicable
This is a static chart image with no in-chart controls to operate.
Companion media, when applicable
There is no separate companion audio or video; the chart image is the full visual on this page.