Source page: McKinsey & Company
Commentary
From face time to FaceTime
Organization | Remote work
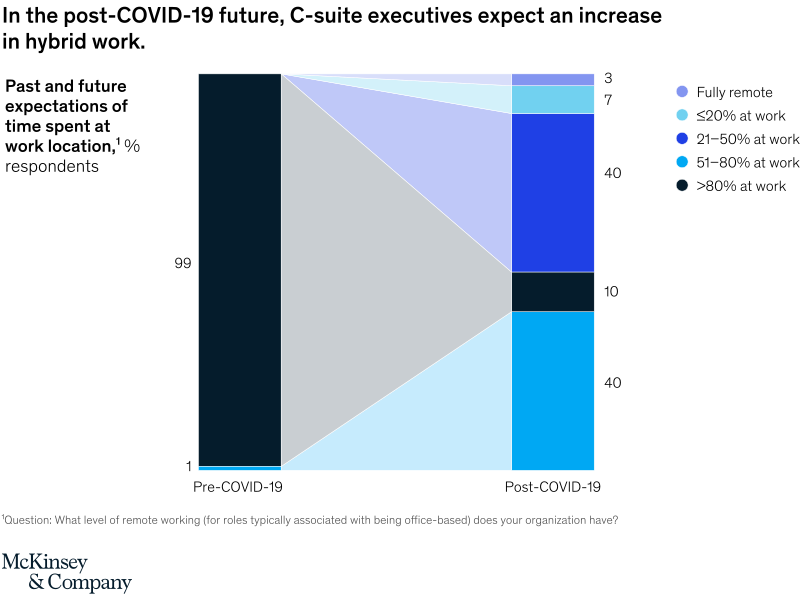
May 27, 2021 – Most companies expected employees to come into the office before the pandemic. Now more accustomed to working via video calls, most C-suite executives expect a hybrid work model to be the norm in the future.
To read the article, see “What executives are saying about the future of hybrid work,” May 17, 2021.
customizer here
Visual form
Two-column work-location transition chart.
Layout / body structure
The chart is built as a before-and-after comparison with one stacked column for pre-COVID-19 and one stacked column for post-COVID-19, linked by angled transition bands between them. Read the left column first to see the old concentration in one work-location bucket, then read the right column from bottom to top using the legend to identify how the future mix splits across five remote-work ranges.
What is being compared
The chart compares C-suite executives’ past and future expectations of time spent at work location for office-based roles. It compares the pre-COVID-19 distribution with the expected post-COVID-19 distribution across five categories: fully remote, up to 20 percent at work, 21 to 50 percent at work, 51 to 80 percent at work, and more than 80 percent at work.
Measurement system
Each column is a 100-percent stack, so the measure is the share of respondents in each work-location category. Values are printed directly inside or beside the post-COVID-19 segments, while the pre-COVID-19 column shows the dominant 99 percent share for more than 80 percent at work and the tiny residual 1 percent share at the bottom.
Visible structure inside the graphic
The left column is almost entirely a single dark block, while the right column fans out into five differently colored segments. The connecting bands between the columns visualize the redistribution of work time from an almost fully on-site norm into a future mix dominated by the two hybrid middle ranges.
Main takeaway from the visual
Executives expect hybrid work to become the norm after COVID-19, replacing the near-total concentration in mostly on-site work that existed before the pandemic. The right column makes that visible by putting 40 percent in the 21 to 50 percent at-work band and another 40 percent in the 51 to 80 percent band, while the more than 80 percent at-work share shrinks sharply.
Key standout values or extremes
Pre-COVID-19, 99 percent of respondents sat in the more-than-80-percent-at-work category. Post-COVID-19, the distribution shifts to 40 percent in 21 to 50 percent at work, 40 percent in 51 to 80 percent at work, 10 percent in more than 80 percent at work, 7 percent in up to 20 percent at work, and 3 percent fully remote.
Controls / sequence, when applicable
This is a static chart image with no in-chart controls to operate.
Companion media, when applicable
There is no separate companion audio or video; the chart image is the full visual on this page.