Source page: McKinsey & Company
Commentary
From poverty to empowerment
Growth | Sustainability | Diversity & Inclusion
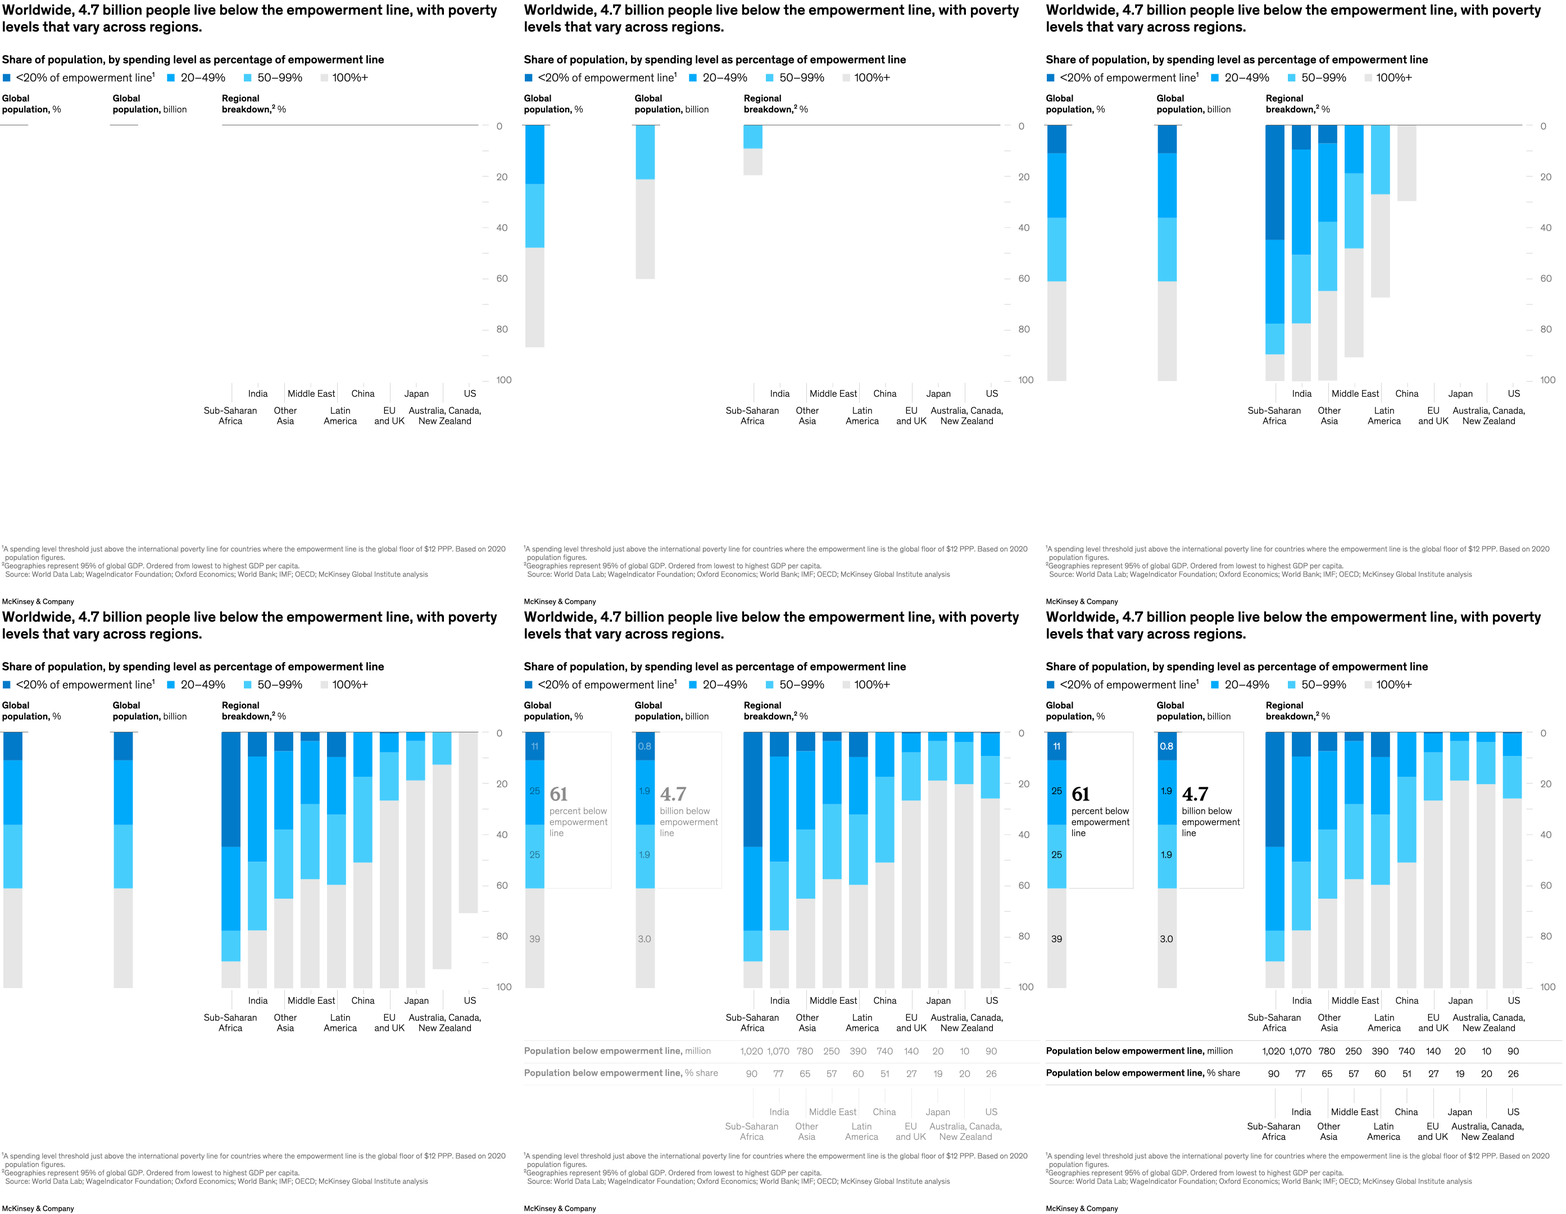
October 5, 2023 – What would it take to raise living standards and get on a path to net zero? One way to begin addressing these simultaneous challenges is understanding the empowerment line, the point at which individuals can meet their essential needs and begin to achieve security. According to Anu Madgavkar, a partner of the McKinsey Global Institute (MGI), MGI chair Sven Smit, and coauthors, about 4.7 billion people worldwide—approximately 60 percent of the global population—live below the empowerment line. Productivity-driven growth, business innovation, and technology advances could help close the empowerment gap while also contributing to net-zero goals.
To read the report, see “From poverty to empowerment: Raising the bar for sustainable and inclusive growth,” September 18, 2023.
customizer here
Visual form
Multi-part composition chart with a regional breakdown. It combines global summary views with a comparative regional panel.
Layout / body structure
The chart is arranged in linked sections: a global population percentage view, a global population-in-billions view, and a regional breakdown that runs across major geographies from Sub-Saharan Africa through the United States. The reading order moves from the global total to the more detailed regional comparison.
What is being compared
It compares population shares across spending bands defined as percentages of the empowerment line, and then shows how those bands vary by region.
Measurement system
The legend uses spending levels below 20 percent of the empowerment line, 20 to 49 percent, 50 to 99 percent, and 100 percent or above. The chart uses both population percentages and population-in-billions framing, depending on the section.
Visible structure inside the graphic
The visual starts with global summary headings and then widens into a regional panel with geographies laid out along the bottom and a percentage scale running vertically. The four-band legend at the top tells the reader how to decode the different spending levels across the global and regional sections.
Main takeaway from the visual
A very large share of the world still sits below the empowerment line, but the severity is not evenly distributed. The regional ordering makes the disparity clear by placing the lowest-spending populations and the richest-region outcomes on the same comparative axis.
Key standout values or extremes
The headline number is 4.7 billion people below the empowerment line. The regional panel also makes the distributional extreme visible by contrasting lower-income regions such as Sub-Saharan Africa with the much higher-spending regions at the far right of the chart.
Controls / sequence, when applicable
This is a static chart image with no in-chart controls to operate.
Companion media, when applicable
There is no separate companion audio or video; the chart image is the full visual on this page.