Source page: McKinsey & Company
Commentary
Full throttle
Automotive | Electric vehicles
May 5, 2023 – Electric-vehicle (EV) sales have sped up over the last couple of years. Between 2020 and 2022, EV sales grew by more than 90 percent in both the United States and Europe and by more than 300 percent in China. According to partner Patrick Schaufuss and coauthors, by 2035, EVs will likely account for more than 65 percent of all new light-vehicle sales across the global automotive market—creating both pressure and opportunities for powertrain suppliers.
To read the article, see “Automotive powertrain suppliers face a rapidly electrifying future,” March 31, 2023.
customizer here
Visual form
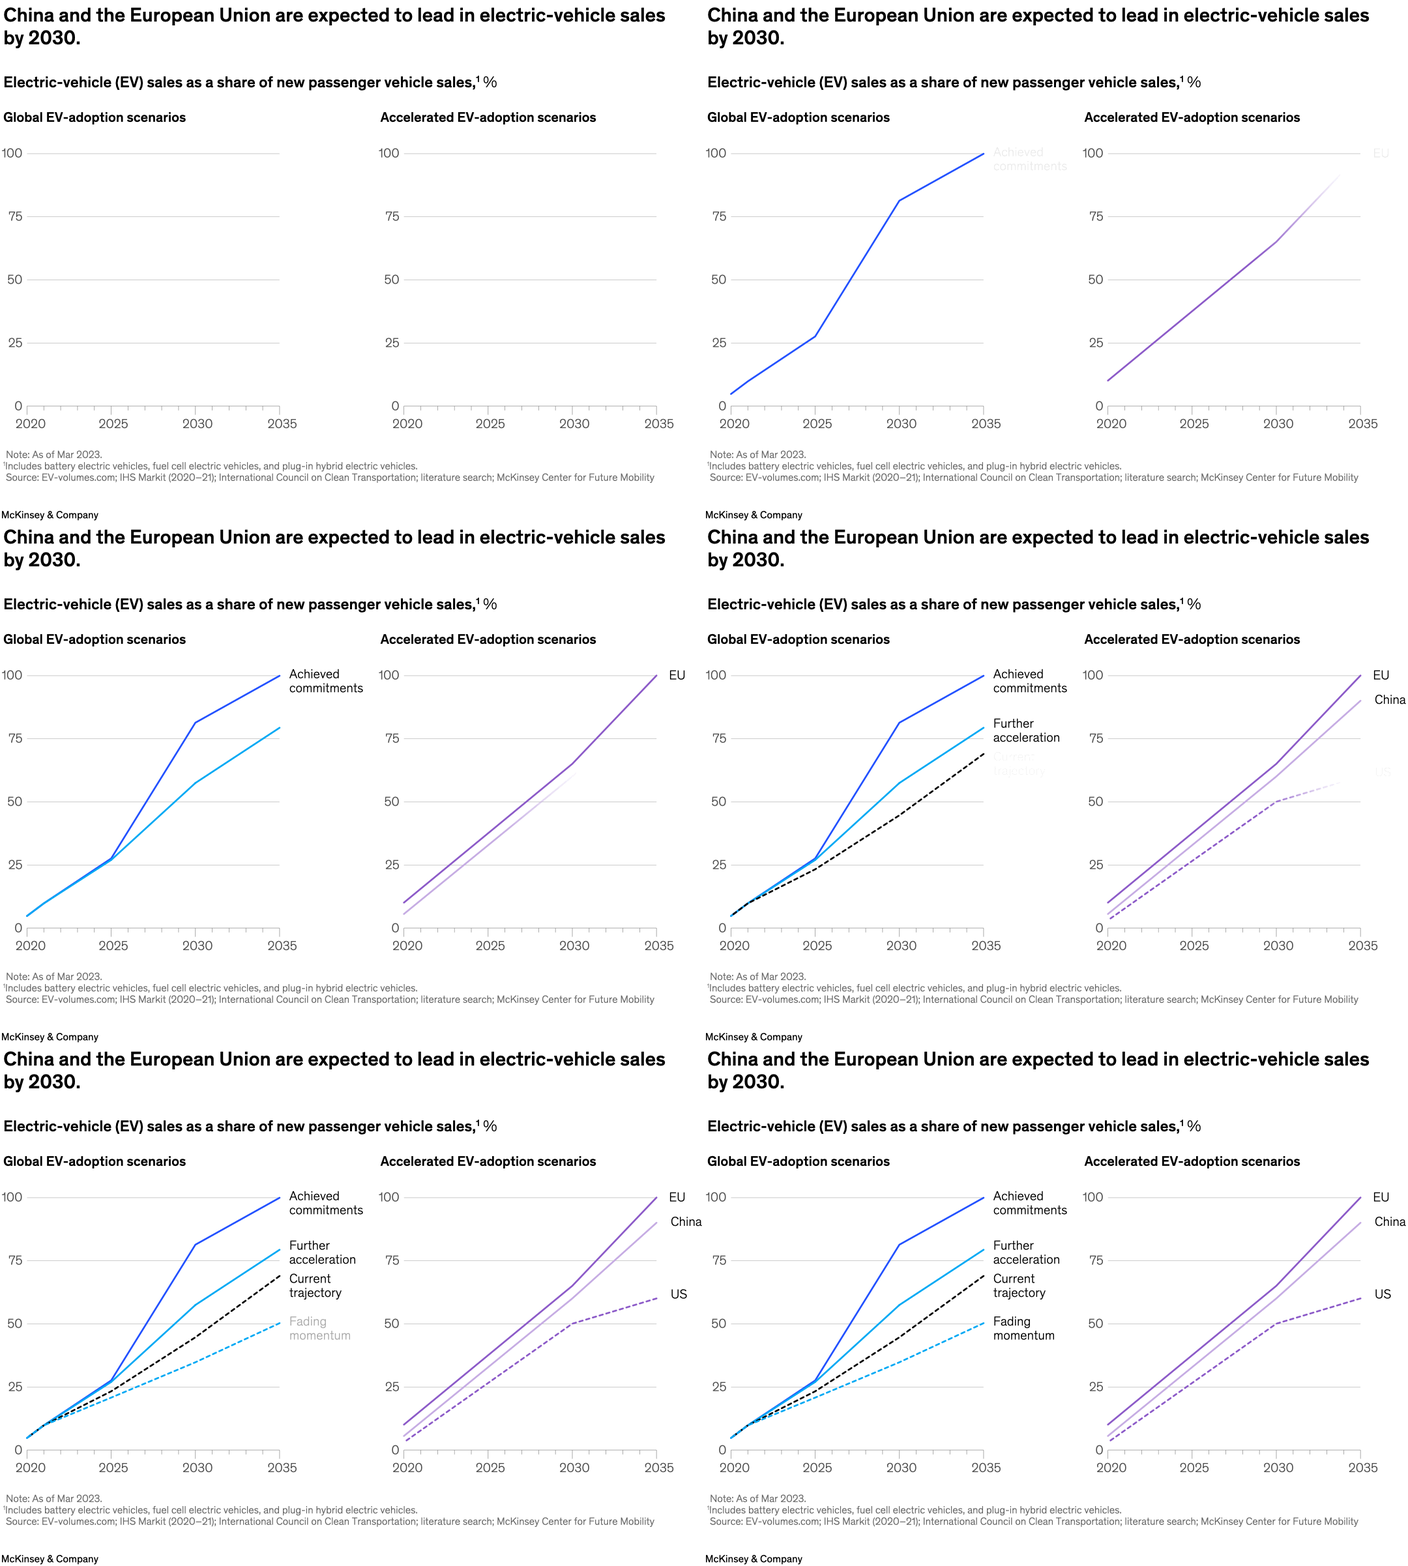
Two-panel line-chart forecast.
Layout / body structure
The visual is split into a left panel for global EV-adoption scenarios and a right panel for accelerated EV-adoption scenarios by region, both read left to right from 2020 to 2035 on the same 0 to 100 percent scale.
What is being compared
It compares different global adoption paths on the left and then compares the regional leaders in an accelerated-adoption case on the right, focusing on the EU, China, and the United States.
Measurement system
The vertical measure is electric-vehicle sales as a share of new passenger-vehicle sales, and the horizontal measure is time from 2020 through 2035.
Visible structure inside the graphic
The left panel uses four scenario lines labeled achieved commitments, further acceleration, current trajectory, and fading momentum, while the right panel uses three regional lines with end labels printed at the right edge of the plot.
Main takeaway from the visual
The panels together show EV adoption rising quickly under several scenarios, but the highest lines belong to China and especially the EU by 2035, while the United States remains visibly below those two leaders.
Key standout values or extremes
In the global scenarios panel, achieved commitments rises to 100 percent by 2035 while fading momentum ends near 50 percent; in the accelerated regional panel, the EU reaches 100 percent, China ends around 90 percent, and the United States around 60 percent.
Controls / sequence, when applicable
This is a static chart image with no in-chart controls to operate.
Companion media, when applicable
There is no separate companion audio or video; the chart image is the full visual on this page.