Source page: McKinsey & Company
Commentary
Gen AI's ROI
Artificial Intelligence | Digital
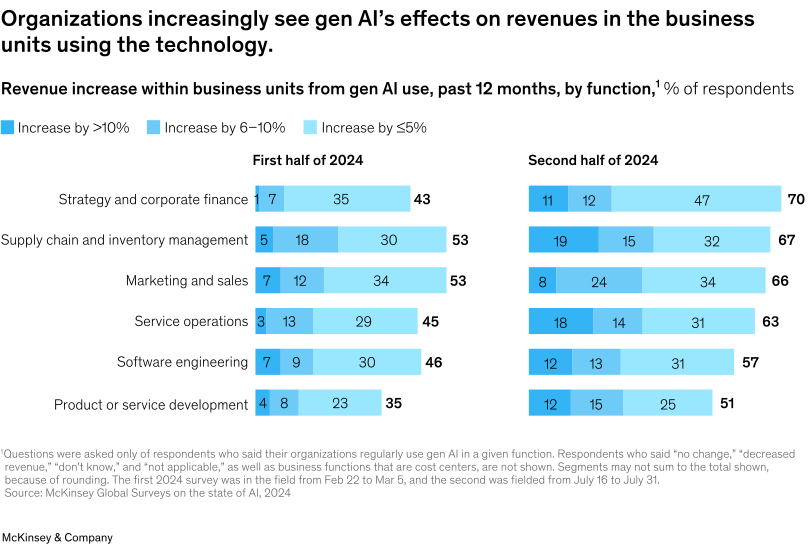
April 30, 2025 – Gen AI is delivering measurable financial results, with companies noting revenue increases over the course of a year. A greater share of respondents reported revenue increases due to gen AI use in a July 2024 survey than they did in a survey in early 2024, Senior Partner Lareina Yee and coauthors note, with the biggest increases observed in service operations. Larger proportions of respondents across business functions in the second survey than in the first indicated revenue increases of 10 percent or more.
To read the survey, see “The state of AI: How organizations are rewiring to capture value,” March 12, 2025.
customizer here
Visual form
Two-panel horizontal stacked bar chart. The chart compares reported revenue increases from gen AI use across business functions in the first and second halves of 2024.
Layout / body structure
The page is split into two side-by-side panels, one for the first half of 2024 and one for the second half of 2024. Within each panel, the reader moves down the list of business functions and reads each bar from left to right across the three revenue-increase bands.
What is being compared
The chart compares business functions such as strategy and corporate finance, supply chain and inventory management, marketing and sales, service operations, software engineering, and product or service development. It is also comparing the distribution of reported revenue gains across two survey periods.
Measurement system
Everything is expressed as a percentage of respondents. The stacked bars are divided into increase by more than 10 percent, increase by 6 to 10 percent, and increase by 5 percent or less, with totals printed at the right edge of each function’s bar.
Visible structure inside the graphic
Each function is shown as one horizontal stacked bar per survey period, using three shades of blue for the three revenue-increase bands. The left panel and right panel use the same function order and color encoding, so the structure invites direct period-to-period comparison of both the total bar length and the size of the darker high-increase segment.
Main takeaway from the visual
The visible takeaway is that reported revenue impact from gen AI became broader and stronger in the second half of 2024. Most functions show longer total bars in the later panel, and the share reporting increases of more than 10 percent becomes noticeably larger in several functions, especially service operations and supply chain.
Key standout values or extremes
Strategy and corporate finance rises from a total of 43 to 70, supply chain and inventory management from 53 to 67, marketing and sales from 53 to 66, and service operations from 45 to 63. In the darkest over-10-percent segment, service operations jumps from 3 to 18 and supply chain rises from 5 to 19, which are two of the clearest visual increases in the chart.
Controls / sequence, when applicable
This is a static chart image with no in-chart controls to operate.
Companion media, when applicable
There is no separate companion audio or video; the chart image is the full visual on this page.