Source page: McKinsey & Company
Commentary
Generating value with gen AI
Financial services | Artificial Intelligence
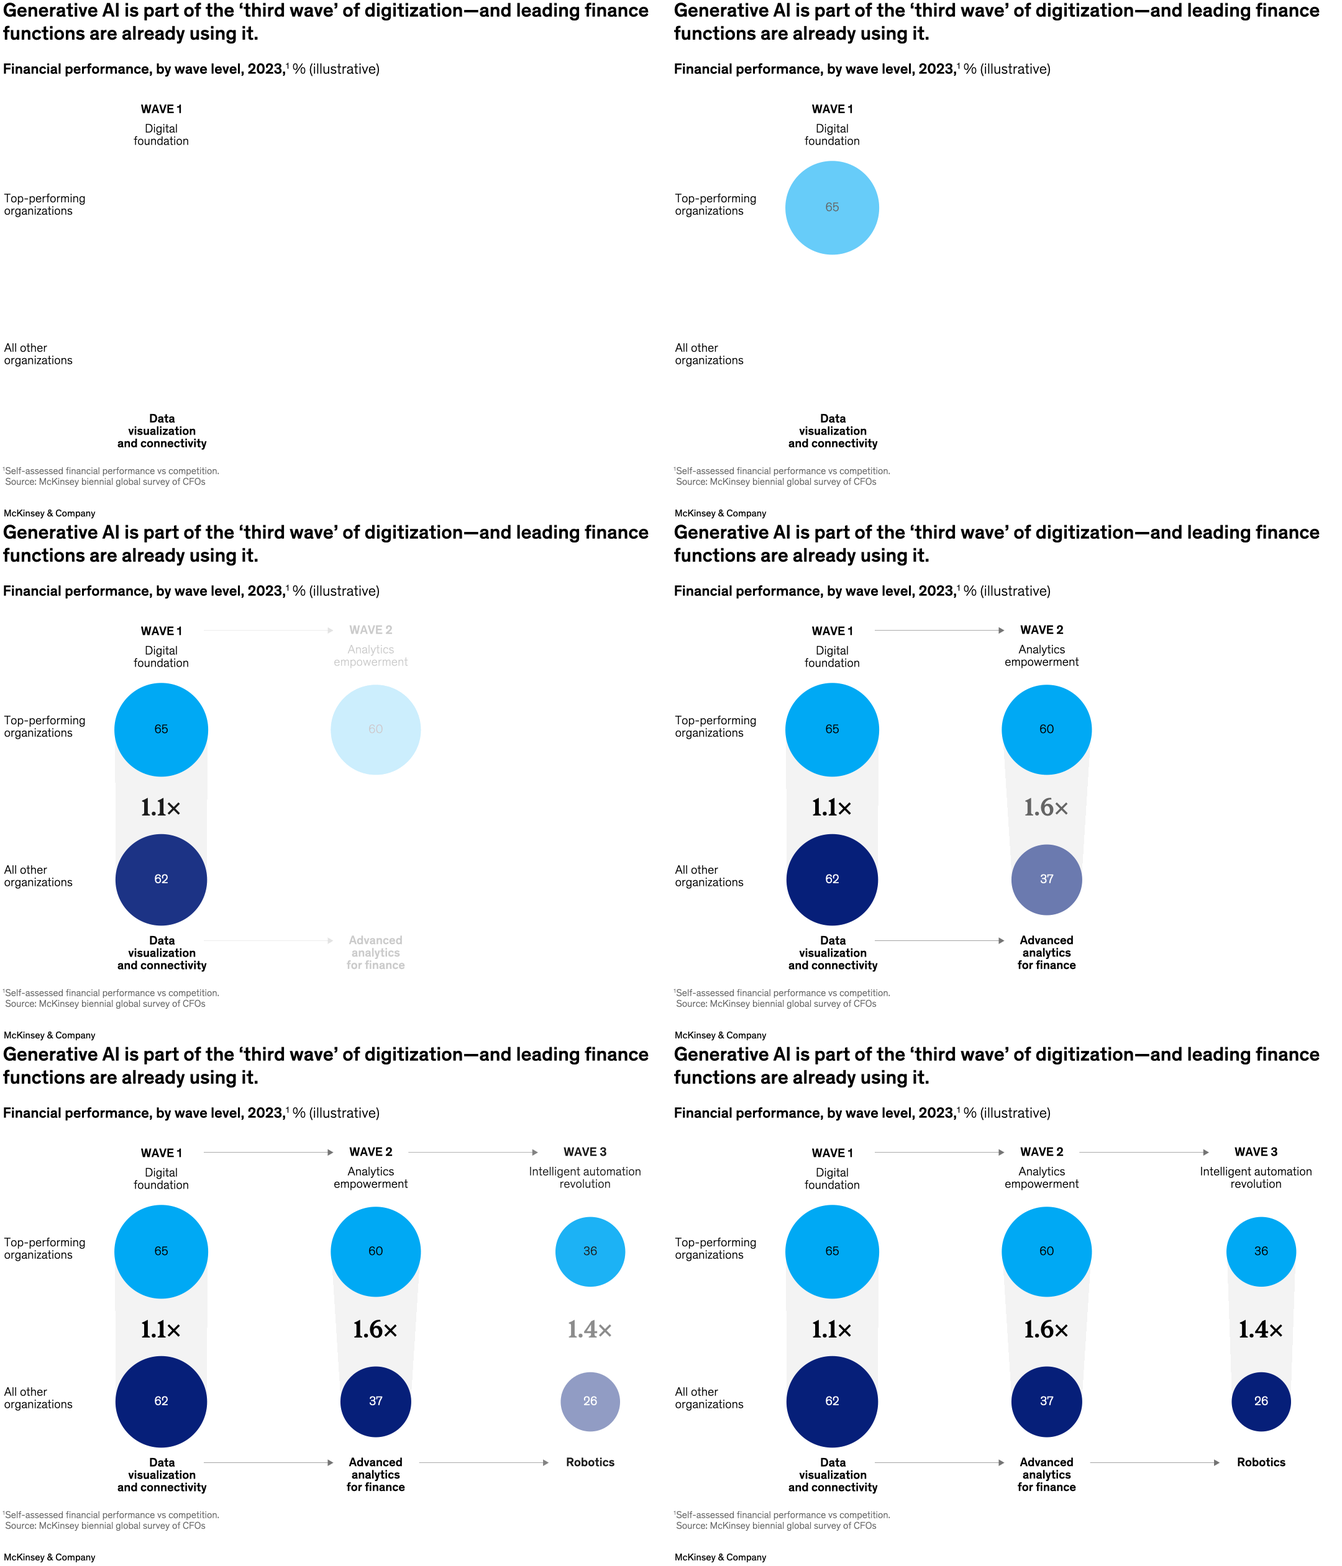
December 13, 2023 – CFOs looking to create value may find opportunities with generative AI (gen AI). According to senior partner Ben Ellencweig and colleagues, many finance functions in large organizations will use gen AI in some capacity within the next five years. Gen AI can be considered as part of a wave of digitization that can nudge companies ahead of their peers. Top-performing finance functions that use intelligent automation such as robotics, for example, financially outperform other organizations by as much as 1.4 times.
To read the article, see “Gen AI A guide for CFOs,” November 15, 2023.
customizer here
Visual form
Three-step bubble comparison arranged as a wave progression. Each step compares top-performing organizations with all other organizations and annotates the relative performance multiplier in the middle.
Layout / body structure
The graphic is laid out horizontally from Wave 1 to Wave 3. Each wave has a top bubble for top-performing organizations, a bottom bubble for all other organizations, and a central wedge that frames the performance multiple connecting the two levels.
What is being compared
The visual compares financial performance across three digitization waves: digital foundation, analytics empowerment, and intelligent automation revolution. Within each wave it contrasts leading organizations with everyone else and ties each wave to a representative finance capability such as data visualization and connectivity, advanced analytics for finance, or robotics.
Measurement system
The values are percentages for financial performance in 2023, and the center labels summarize the ratio between the top-performing group and all other organizations. The bubbles carry the raw percentage values while the center notation highlights the performance multiple.
Visible structure inside the graphic
The display uses three repeated modules with two blue circles and a labeled bridge between them. That repeated architecture makes the chart read like a staged maturity model, with each wave showing both the level achieved and the gap between stronger and weaker organizations.
Main takeaway from the visual
Generative AI is presented as part of a broader third wave of digitization rather than as a stand-alone technology bet. The chart makes that visible by placing AI-related intelligent automation after the digital-foundation and analytics waves and by showing that top performers outscore other organizations at every stage.
Key standout values or extremes
Wave 1 shows 65 percent for top-performing organizations versus 62 percent for all other organizations, a 1.1 times relationship. Wave 2 widens to 60 versus 37, or 1.6 times, and Wave 3 shows 36 versus 26, or 1.4 times.
Controls / sequence, when applicable
This is a static chart image with no in-chart controls to operate.
Companion media, when applicable
There is no separate companion audio or video; the chart image is the full visual on this page.