Source page: McKinsey & Company
Commentary
Getting to greener steel
Metals and mining | Decarbonization
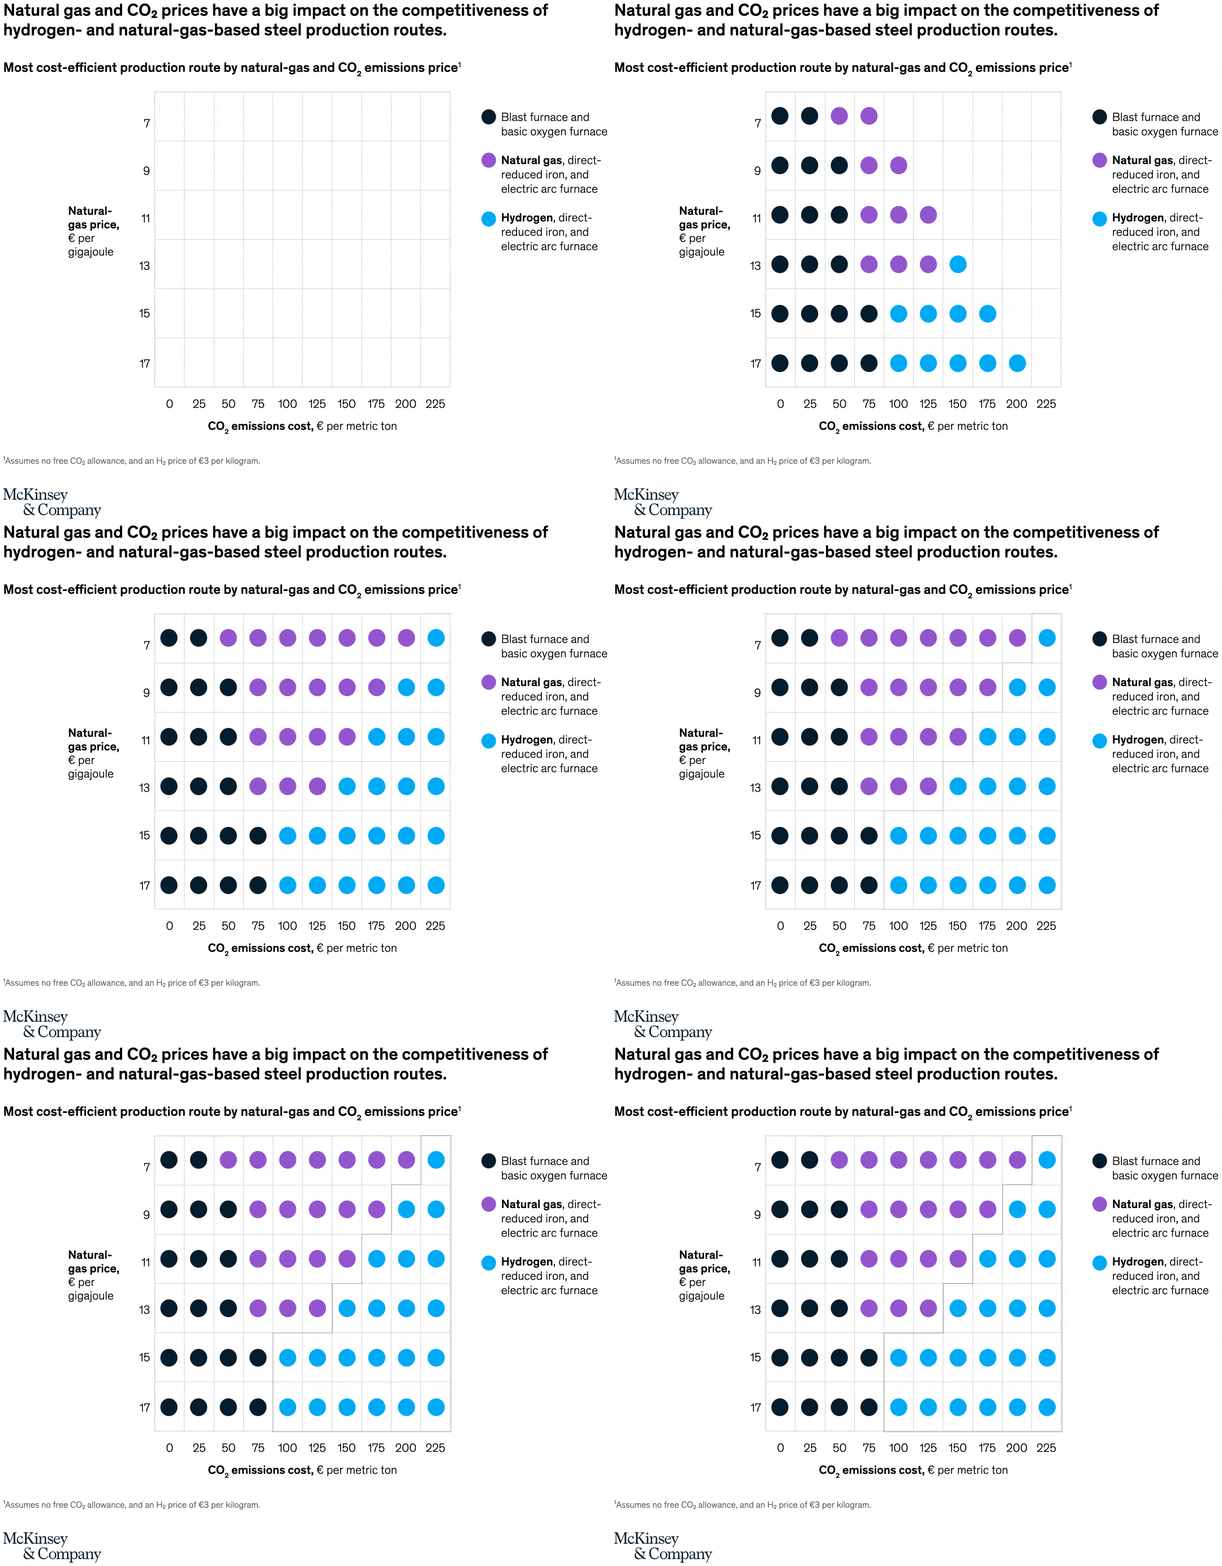
August 24, 2022 – As European steelmakers look to decarbonize production, the price of natural gas and CO2 emissions could have a significant impact on the cost competitiveness of greener options. For example, when examining the cost competitiveness of three potential approaches, a path based on green hydrogen—a replacement for natural gas in certain production methods—used in combination with direct-reduced-iron and electric-arc-furnace processes is already cost competitive at a natural-gas price of €15 per gigajoule and a CO2 price of €100 per metric ton.
To read the article, see “Safeguarding green steel in Europe: Facing the natural-gas challenge,” June 21, 2022.
customizer here
Visual form
A matrix chart made of colored dots.
Layout / body structure
The chart is one square grid read across the horizontal CO2-cost axis and down the vertical natural-gas-price axis. A legend on the right ties each dot color to a steelmaking route, so the eye moves from the axes through the grid and then over to the process key.
What is being compared
The chart compares which of three steel-production routes is most cost efficient under different combinations of natural-gas prices and CO2-emissions costs. The three routes are blast furnace and basic oxygen furnace, natural gas with direct-reduced iron and electric arc furnace, and hydrogen with direct-reduced iron and electric arc furnace.
Measurement system
The horizontal axis measures CO2 emissions cost in euros per metric ton from 0 to 225, and the vertical axis measures natural-gas price in euros per gigajoule from 7 to 17. Each dot marks the winning production route at that price combination rather than showing a continuous line or bar height.
Visible structure inside the graphic
The grid is filled with dark navy, purple, and light blue circles. Dark navy dominates the low-CO2-cost cells on the left, purple takes over much of the middle of the grid, and light blue expands across the right side and lower-right half where emissions costs are higher and gas is more expensive. The legend spells out the process behind each color so the whole pattern reads like a competitiveness map.
Main takeaway from the visual
The visual shows that the winning steel route shifts in a stepwise way as gas and carbon prices change. Traditional blast furnace production holds the low-cost corner, natural-gas DRI-EAF is strongest across the middle, and hydrogen DRI-EAF becomes the most cost-efficient option across a broad stretch of higher CO2 prices and higher gas prices.
Key standout values or extremes
The clearest threshold on the chart is that at a natural-gas price of 15 euros per gigajoule and a CO2 cost of 100 euros per metric ton, the cell is already light blue, meaning the hydrogen route is competitive there. At the opposite extreme, the leftmost low-carbon-cost cells at 0 to 50 euros per ton stay dark navy across much of the grid, while the far-right cells around 200 to 225 euros per ton are predominantly light blue.
Controls / sequence, when applicable
This is a static chart image with no in-chart controls to operate.
Companion media, when applicable
There is no separate companion audio or video; the chart image is the full visual on this page.