Source page: McKinsey & Company
Commentary
Global disease burden expected to increase over next 20 years as populations age
Public Health
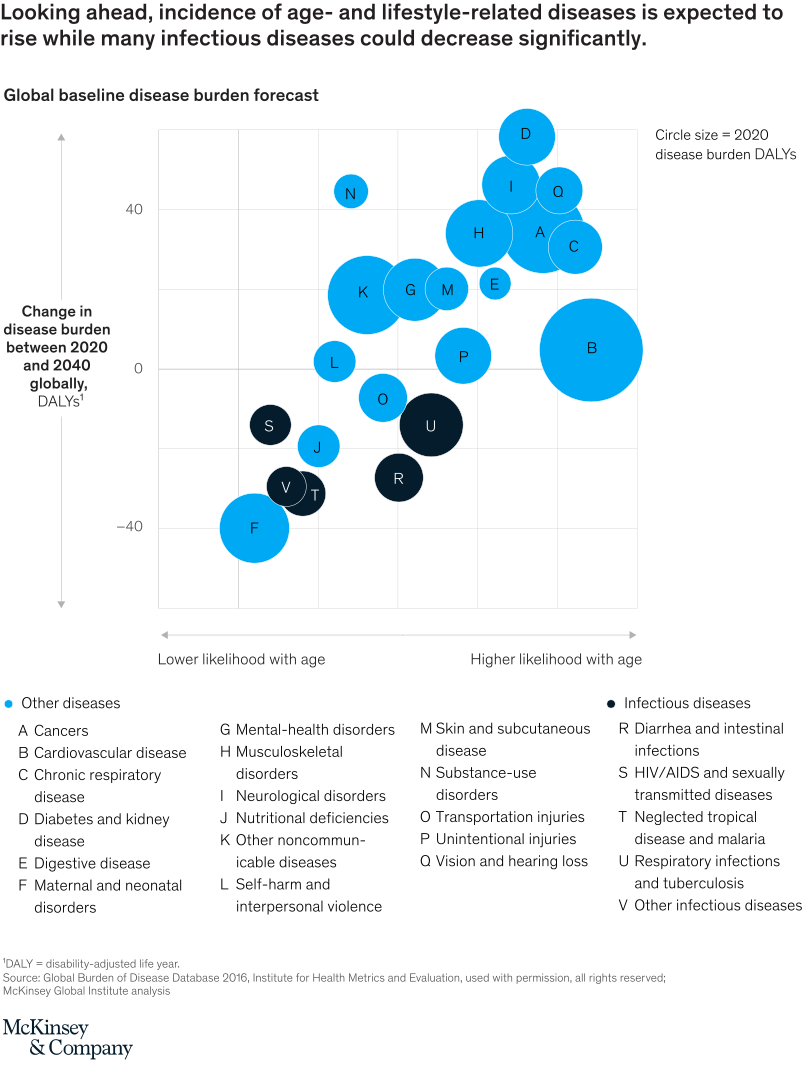
July 28, 2020 – Without broader application of known interventions, diseases associated with age and income—such as diabetes, cardiovascular disease, and some cancers—will rise through 2040, while infectious diseases may decline.
To read the report, see “Prioritizing health: A prescription for prosperity,” July 8, 2020.
customizer here
Visual form
Scatter Plot: bubble forecast of disease-burden change by age association and current DALY burden.
Layout / body structure
Diseases are plotted as labeled bubbles. The horizontal axis moves from lower to higher likelihood with age, the vertical axis shows expected change in disease burden from 2020 to 2040, and bubble size represents the 2020 disease burden.
What is being compared
It compares infectious and noninfectious diseases by three dimensions: how strongly they are associated with age, how their global burden is expected to change by 2040, and how large their burden was in 2020.
Measurement system
The vertical axis is change in disease burden between 2020 and 2040 in global DALYs. The horizontal axis is likelihood with age, and bubble area represents 2020 disease burden.
Visible structure inside the graphic
Many age- and lifestyle-related conditions sit toward the upper-right with positive expected burden growth. Several infectious diseases sit lower on the chart, including bubbles below zero that indicate projected declines.
Main takeaway from the visual
The scatter plot shows that aging populations will shift the disease burden toward chronic and age-associated conditions. Even if many infectious diseases decline, the overall pressure from age- and lifestyle-related disease can rise.
Key standout values or extremes
Diabetes and kidney disease, neurological disorders, cardiovascular disease, chronic respiratory disease, and cancers appear among the higher-burden or higher-growth bubbles. Some infectious-disease bubbles appear below zero, indicating projected declines.
Controls / sequence, when applicable
This is a static bubble scatter plot; there are no in-chart controls to operate.
Companion media, when applicable
There is no separate companion audio or video; the disease-burden scatter plot is the full visual on this page.