Source page: McKinsey & Company
Commentary
Go your own way
COVID-19 | Economics | North America
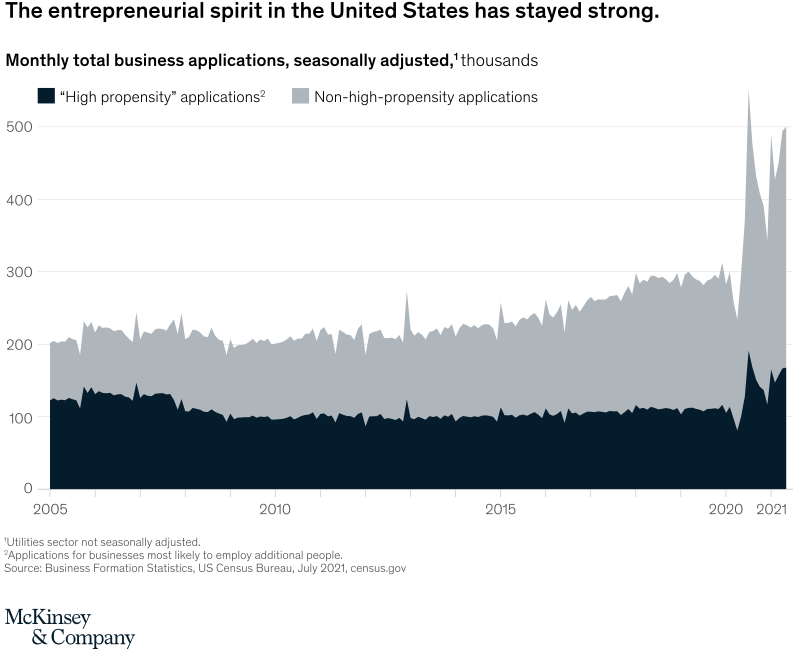
July 30, 2021 – Only once since 2005 had the US recorded 340,000 new business applications in a month. Then came COVID-19. Since June 2020, every single month has at least matched that level. And the momentum is positive. The first five months of 2021 saw an average of 472,000 new business applications a month, many more than in the last five months of 2020 (410,000). New businesses with a high propensity to hire additional workers were even more numerous.
To read the article, see “Trends that will define 2021 and beyond: Six months on,” July 21, 2021.
customizer here
Visual form
Stacked area chart over time.
Layout / body structure
The chart is a single time-series panel running from 2005 to 2021, with two stacked bands. Read left to right through the long baseline period, the 2020 surge, and the elevated levels that follow, while watching how the dark lower band and gray upper band contribute to the total.
What is being compared
The chart compares monthly total business applications in the United States between high-propensity applications and non-high-propensity applications. It is also comparing the pre-pandemic pattern with the sharp change during and after the 2020 disruption.
Measurement system
The vertical axis measures applications in thousands, seasonally adjusted. The dark band represents high-propensity applications, the light gray band represents non-high-propensity applications, and their combined height gives the total business applications each month.
Visible structure inside the graphic
A dark lower area stays relatively stable for most of the series, while a lighter upper area grows more dramatically and drives the tallest spikes near the right side. The chart has one continuous stacked silhouette, a two-item legend at the top, and a long horizontal timeline that makes the 2020 – 21 jump visually abrupt.
Main takeaway from the visual
Entrepreneurial activity remained strong and then accelerated sharply during the pandemic period, with the largest visible surge coming from the non-high-propensity portion of applications. The combined stack jumps to record highs near the far right even after an earlier temporary drop.
Key standout values or extremes
For much of 2005 to 2019 the total stack sits around the low-200-thousand range, while the post-2020 period pushes the total toward roughly 500 thousand at its highest spike. The high-propensity band rises as well, but the most dramatic movement is in the lighter non-high-propensity layer, which creates the largest top-edge swings in the chart.
Controls / sequence, when applicable
This is a static chart image with no in-chart controls to operate.
Companion media, when applicable
There is no separate companion audio or video; the chart image is the full visual on this page.