Source page: McKinsey & Company
Commentary
Green shipping won’t be cheap
Shipping | Sustainability
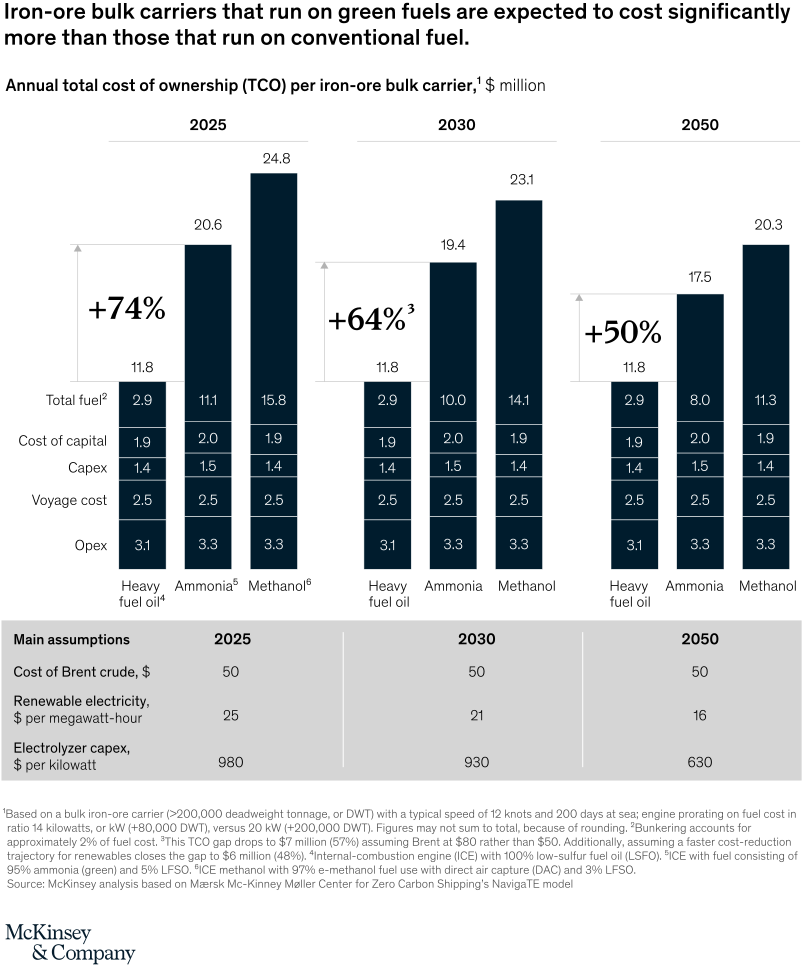
February 9, 2022 – In 2019, some 65 million metric tons of iron ore were exported from Australian mines to Japanese steelmakers. A total of 111 bulk carriers on the route produced 1.7 million metric tons of CO2 emissions. To get this vital trade route to net zero, ammonia engines should be in use by 2024. However, our analysis suggests that even by 2030, a carrier that runs on green ammonia will still cost 64 percent more in total cost of ownership than a ship that runs on fuel oil.
To read the article, see “Green corridors: A lane for zero-carbon shipping,” December 21, 2021.
customizer here
Visual form
Stacked cost-comparison column chart.
Layout / body structure
The chart is organized as grouped columns for 2025, 2030, and 2050, with fuel options compared within each year. Reader moves left to right across the years and, within each year group, compares heavy fuel oil against ammonia and methanol using the stacked cost components inside each column.
What is being compared
The chart compares annual total cost of ownership for iron-ore bulk carriers running on conventional heavy fuel oil versus green-fuel options such as ammonia and methanol. It is comparing ship-fuel pathways across three time horizons rather than showing only a single-year snapshot.
Measurement system
The columns are measured in millions of dollars of annual total cost of ownership per carrier. The stack breaks that total into components such as opex, voyage cost, capex, cost of capital, and total fuel, and the page also adds headline premium percentages for green-fuel options relative to conventional fuel.
Visible structure inside the graphic
Each column is stacked by cost component, and the year groupings make it possible to compare both the total height and the internal mix of each fuel option over time. Additional assumption rows below the chart give Brent crude, renewable-electricity, and electrolyzer-cost assumptions, so the page combines the main TCO stacks with a structured assumptions table.
Main takeaway from the visual
Green-fuel shipping remains materially more expensive than conventional-fuel shipping across all three time points, even though the gap narrows over time. The higher total column heights for ammonia and methanol in every year group make the cost premium impossible to miss.
Key standout values or extremes
The page highlights green-fuel premiums of about 74 percent in 2025, 64 percent in 2030, and 50 percent in 2050. It also shows total annual cost levels such as roughly 11.8 million dollars for heavy fuel oil in 2025 versus much higher totals above 17 million and 20 million for the green-fuel alternatives in the same chart.
Controls / sequence, when applicable
This is a static chart image with no in-chart controls to operate.
Companion media, when applicable
There is no separate companion audio or video; the chart image is the full visual on this page.