Source page: McKinsey & Company
Commentary
Greener ventures
Asia | Renewable energy | Sustainability
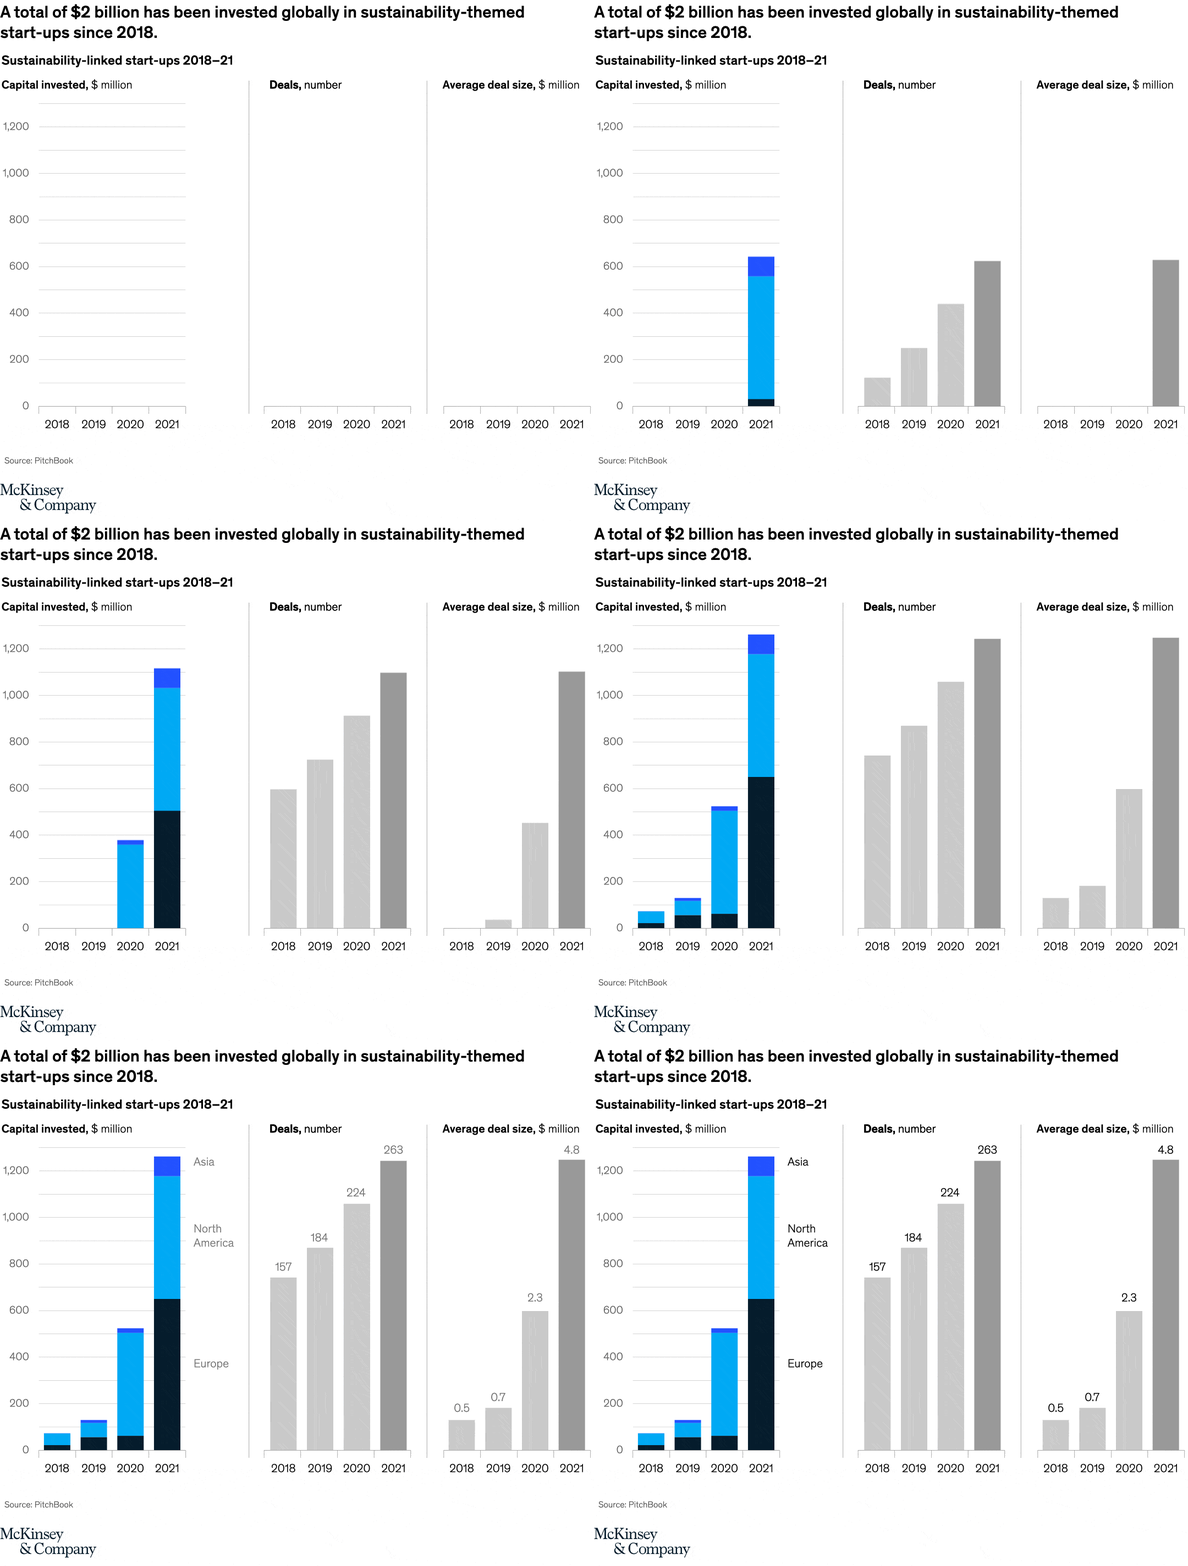
July 25, 2022 – Opportunities for sustainability-themed start-ups are on the rise, thanks to advances in technology, government-funded financing, and regulatory policies. Between 2018 and 2021, $2 billion was invested in sustainability-linked start-ups, with Europe and North America leading the way—and Asia rapidly catching up. According to McKinsey analysis, Asia could potentially see up to a tenfold increase in start-up activity over the next three to four years.
To read the article, see “Seizing green business growth for Asia’s energy players,” April 21, 2022.
customizer here
Visual form
Animated three-panel regional time-series chart.
Layout / body structure
The chart is arranged as three side-by-side panels read left to right: capital invested, number of deals, and average deal size. Each panel uses the same 2018 to 2021 horizontal timeline and overlays regional lines so the viewer can compare Europe, North America, and Asia across all three measures.
What is being compared
The chart compares sustainability-linked start-up activity across regions and across three metrics: how much capital was invested, how many deals were completed, and how large the average deal was. It is therefore comparing both scale and deal economics at the same time.
Measurement system
The left panel is measured in millions of dollars, the middle panel is measured in number of deals, and the right panel is measured in average deal size in millions of dollars. Color separates regions consistently across all three panels so a regional trajectory can be tracked from one metric to the next.
Visible structure inside the graphic
Each panel contains multiple region lines plotted over the same four-year sequence, with endpoint labels calling out the latest visible values. The capital-invested panel shows the largest absolute separation, the deals panel shows how regional activity volume stacks up, and the average-deal-size panel reveals whether the capital story is coming from more deals or bigger individual rounds.
Main takeaway from the visual
The three-panel structure shows sustainability start-up funding accelerating across regions rather than in just one pocket of the market. Europe and North America stay large in both capital and deal counts, but Asia closes ground quickly enough to matter across the full dashboard instead of appearing only as a side note.
Key standout values or extremes
The page headline calls out $2 billion invested globally in sustainability-themed start-ups since 2018. The visible endpoint labels include values such as 263, 224, 184, and 157 in the larger capital-and-deal panels, while the average-deal-size panel shows smaller labeled endpoints including 4.8, 2.3, 0.7, and 0.5 million.
Controls / sequence, when applicable
This is a static chart image with no in-chart controls to operate.
Companion media, when applicable
There is no separate companion audio or video; the chart image is the full visual on this page.