Source page: McKinsey & Company
Commentary
Growth engine no more?
Automotive | Mobility
April 13, 2022 – As the automotive sector shifts toward electric vehicles (EVs), the growth of many internal combustion engine (ICE) product lines could see double-digit declines. Our article breaks down how ICE-component suppliers can maximize value over the next decade.
To read the article, see “ICE businesses: Navigating the energy-transition trend within mobility,” March 14, 2022.
customizer here
Visual form
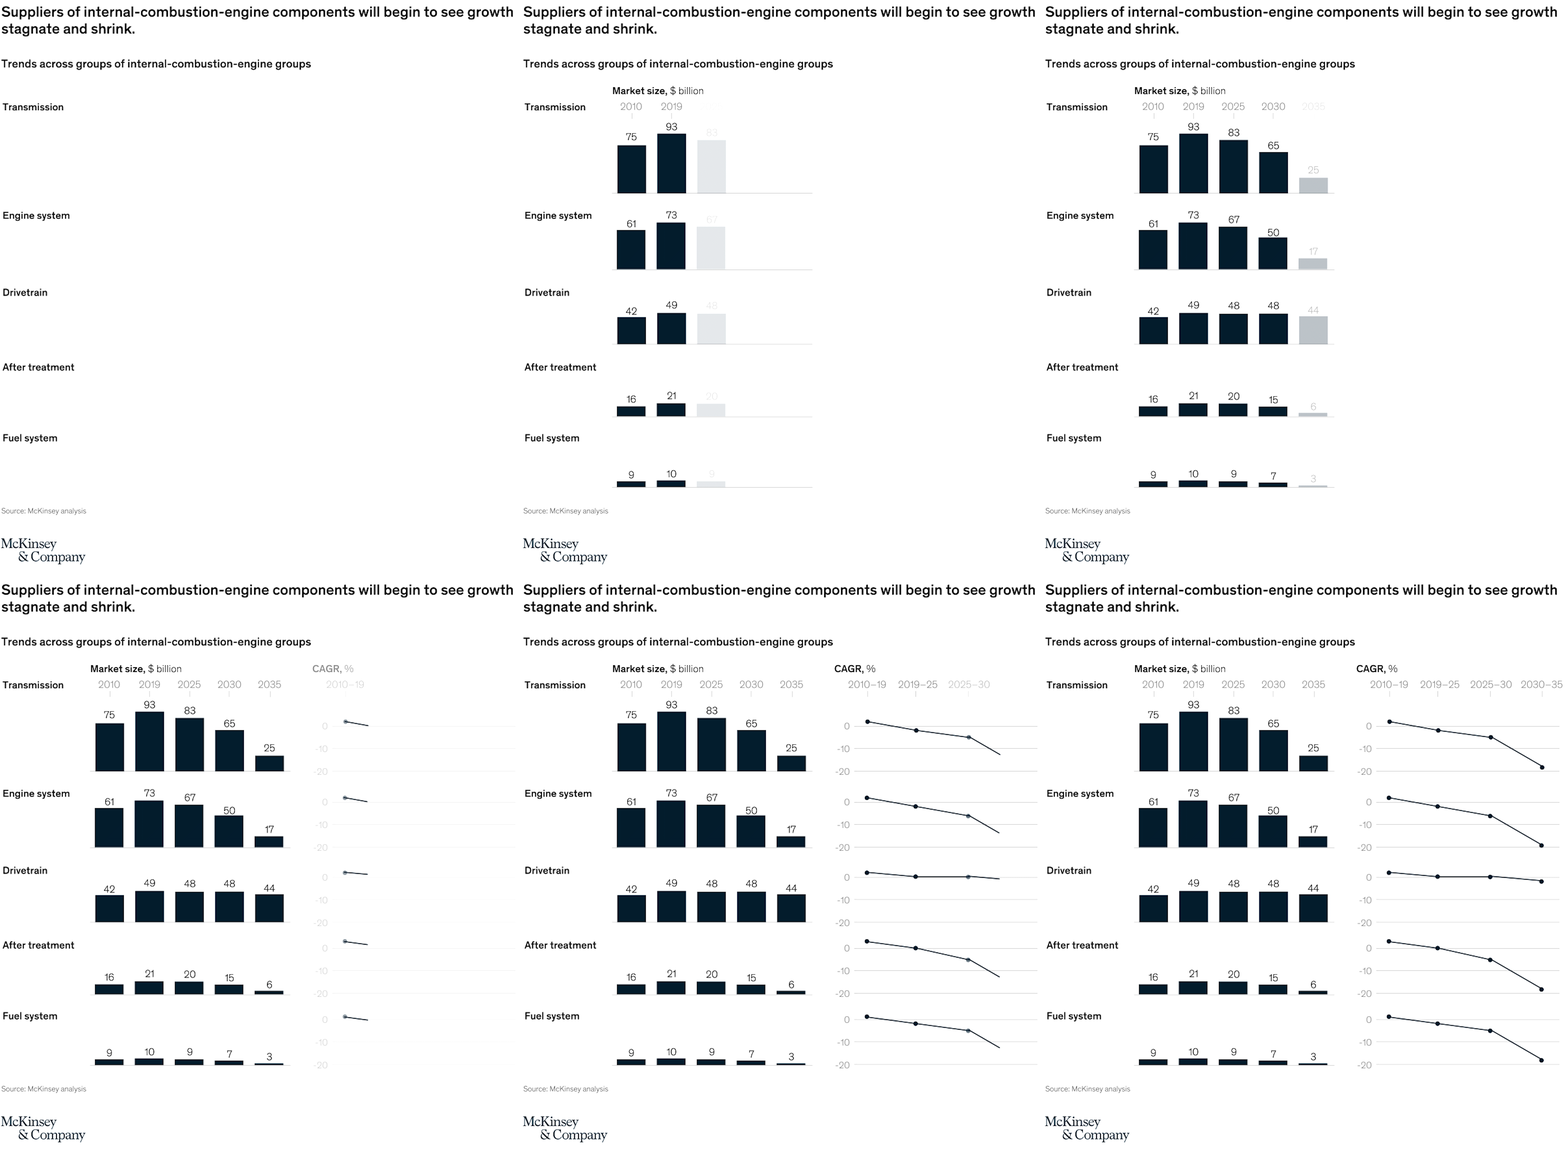
Five-row bar-and-line comparison dashboard.
Layout / body structure
The dashboard is arranged in five horizontal rows, one for each internal-combustion-engine component group. Within each row, the left mini-chart is a market-size column sequence and the right mini-chart is a CAGR line, so the reader should scan left to right across a row before moving down to the next component group.
What is being compared
The page compares transmission, engine system, drivetrain, after treatment, and fuel system components across future periods. For each group it compares the projected market size at five time points and the CAGR path across four intervals from 2010 to 2035.
Measurement system
The left side measures market size in billions of dollars at 2010, 2019, 2025, 2030, and 2035. The right side measures CAGR in percent for 2010 to 2019, 2019 to 2025, 2025 to 2030, and 2030 to 2035, so the chart pairs absolute market levels with the rate of change between periods.
Visible structure inside the graphic
Each row repeats the same grammar: a five-bar sequence on the left and a four-point line on the right. The dashboard format makes it clear that the upper rows start larger but then compress sharply by 2035, while the lower rows are smaller to begin with and still drift downward in both the bar levels and the terminal CAGR points.
Main takeaway from the visual
Internal-combustion-engine component groups are projected to flatten and then shrink, with the steepest late declines concentrated in transmission and engine systems. The rows all tilt downward by the final interval, but the contraction is most dramatic where the market starts large and then falls hard by 2035.
Key standout values or extremes
Transmission peaks at 93 billion dollars in 2019 before sliding to 25 by 2035, and engine systems peak at 73 before dropping to 17. Drivetrain is the most stable of the group at 42, 49, 48, 48, and 44, while after treatment falls from 21 in 2019 to 6 in 2035 and fuel systems fall from 10 to 3; the final CAGR points for transmission, engine systems, after treatment, and fuel systems all drop to roughly the high negative teens, while drivetrain is only mildly negative at the far right.
Controls / sequence, when applicable
This is a static chart image with no in-chart controls to operate.
Companion media, when applicable
There is no separate companion audio or video; the chart image is the full visual on this page.