Source page: McKinsey & Company
Commentary
Growth goals in the Philippines
Asia-Pacific | Economy | Travel
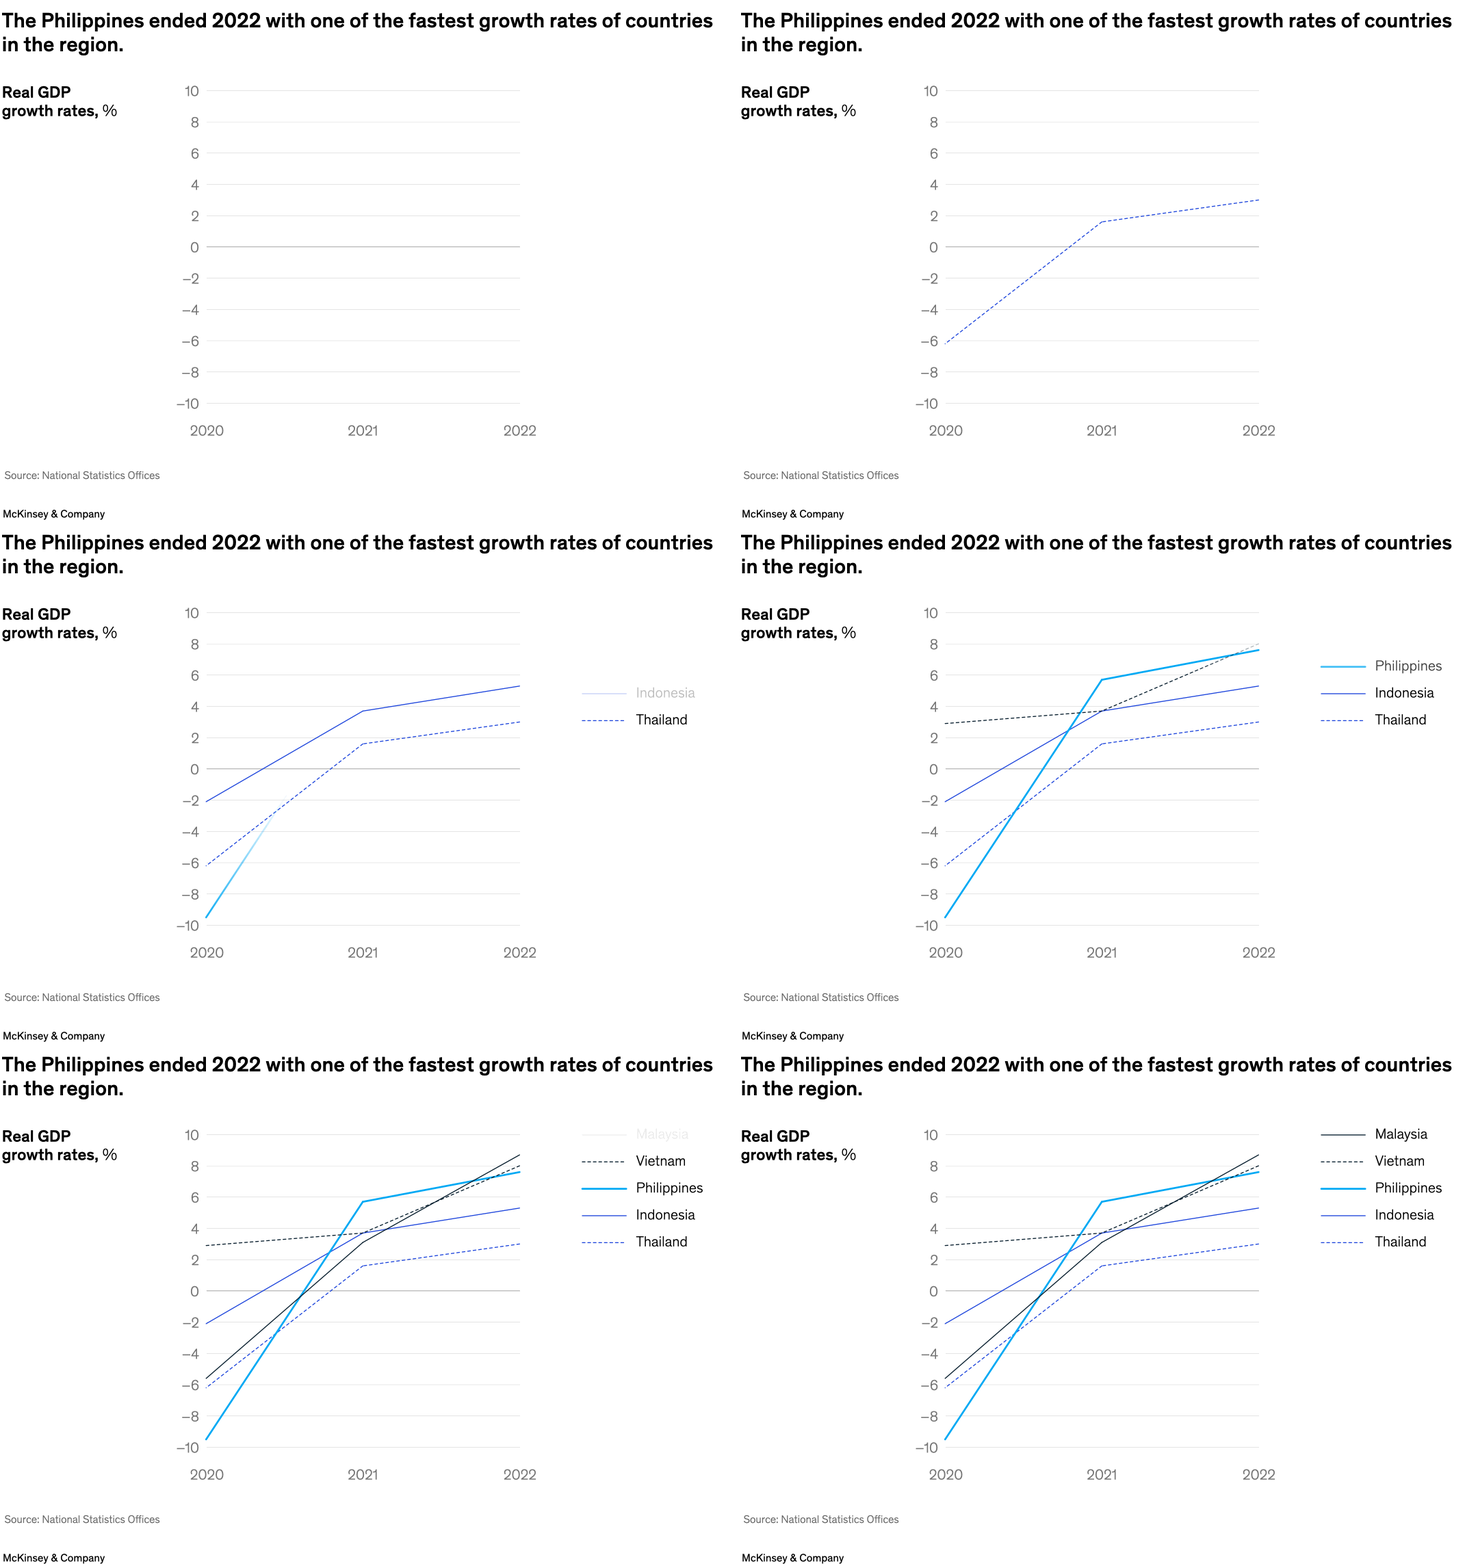
March 30, 2023 – Business leaders in the Philippines looking to emerge from the economic disruptions in recent years may consider an “era thinking” strategy—that is, take the upheavals head-on with an eye toward innovation. According to partners Jon Canto and Kristine Romano and colleagues, the Philippines could see GDP growth of approximately 5 percent this year, a notable rebound after a record 10 percent contraction in 2020.
To read the article, see “What does 2023 hold for the Philippines’ economy?,” March 7, 2023.
customizer here
Visual form
Multi-series line chart.
Layout / body structure
The visual is one chart with a three-year horizontal timeline and five country lines, plus a legend off to the right that identifies each country’s stroke style and color.
What is being compared
It compares real GDP growth rates for the Philippines, Malaysia, Vietnam, Indonesia, and Thailand from 2020 through 2022.
Measurement system
The vertical axis is real GDP growth in percent, and the horizontal axis is year, so the reader is tracking the depth of the 2020 contraction and the speed of the rebound into 2021 and 2022.
Visible structure inside the graphic
Five lines rise from the 2020 starting point into 2021 and then continue upward or flatten into 2022. The Philippines line is highlighted in a brighter blue, which makes its steeper climb and high end point stand out against the more muted comparison lines.
Main takeaway from the visual
The Philippines starts from the deepest downturn in 2020 but then rebounds quickly enough to finish 2022 among the fastest-growing countries in the set, so the chart reads as a sharp recovery story rather than a slow normalization.
Key standout values or extremes
The Philippines falls to roughly negative 10 percent in 2020, rebounds to around 6 percent in 2021, and rises again to roughly 8 percent in 2022. Thailand ends much lower, near 3 percent in 2022, while the other comparison countries cluster between roughly 5 and 8 percent.
Controls / sequence, when applicable
This is a static chart image with no in-chart controls to operate.
Companion media, when applicable
There is no separate companion audio or video; the chart image is the full visual on this page.