Source page: McKinsey & Company
Commentary
Growth spurt
Industrials & Electronics | Automotive
April 25, 2022 – Embedded systems—the combination of software and electrical components—are becoming more integral than ever to the automotive industry. Already a multibillion-dollar market, automotive embedded software expects growth rates of roughly 9 percent until 2030. Advanced driver-assistance systems (ADAS) and automated driving (AD) are dependent on these systems, which will only increase their popularity in the coming years.
To read the article, see “Cracking the complexity code in embedded systems development,” March 25, 2022.
customizer here
Visual form
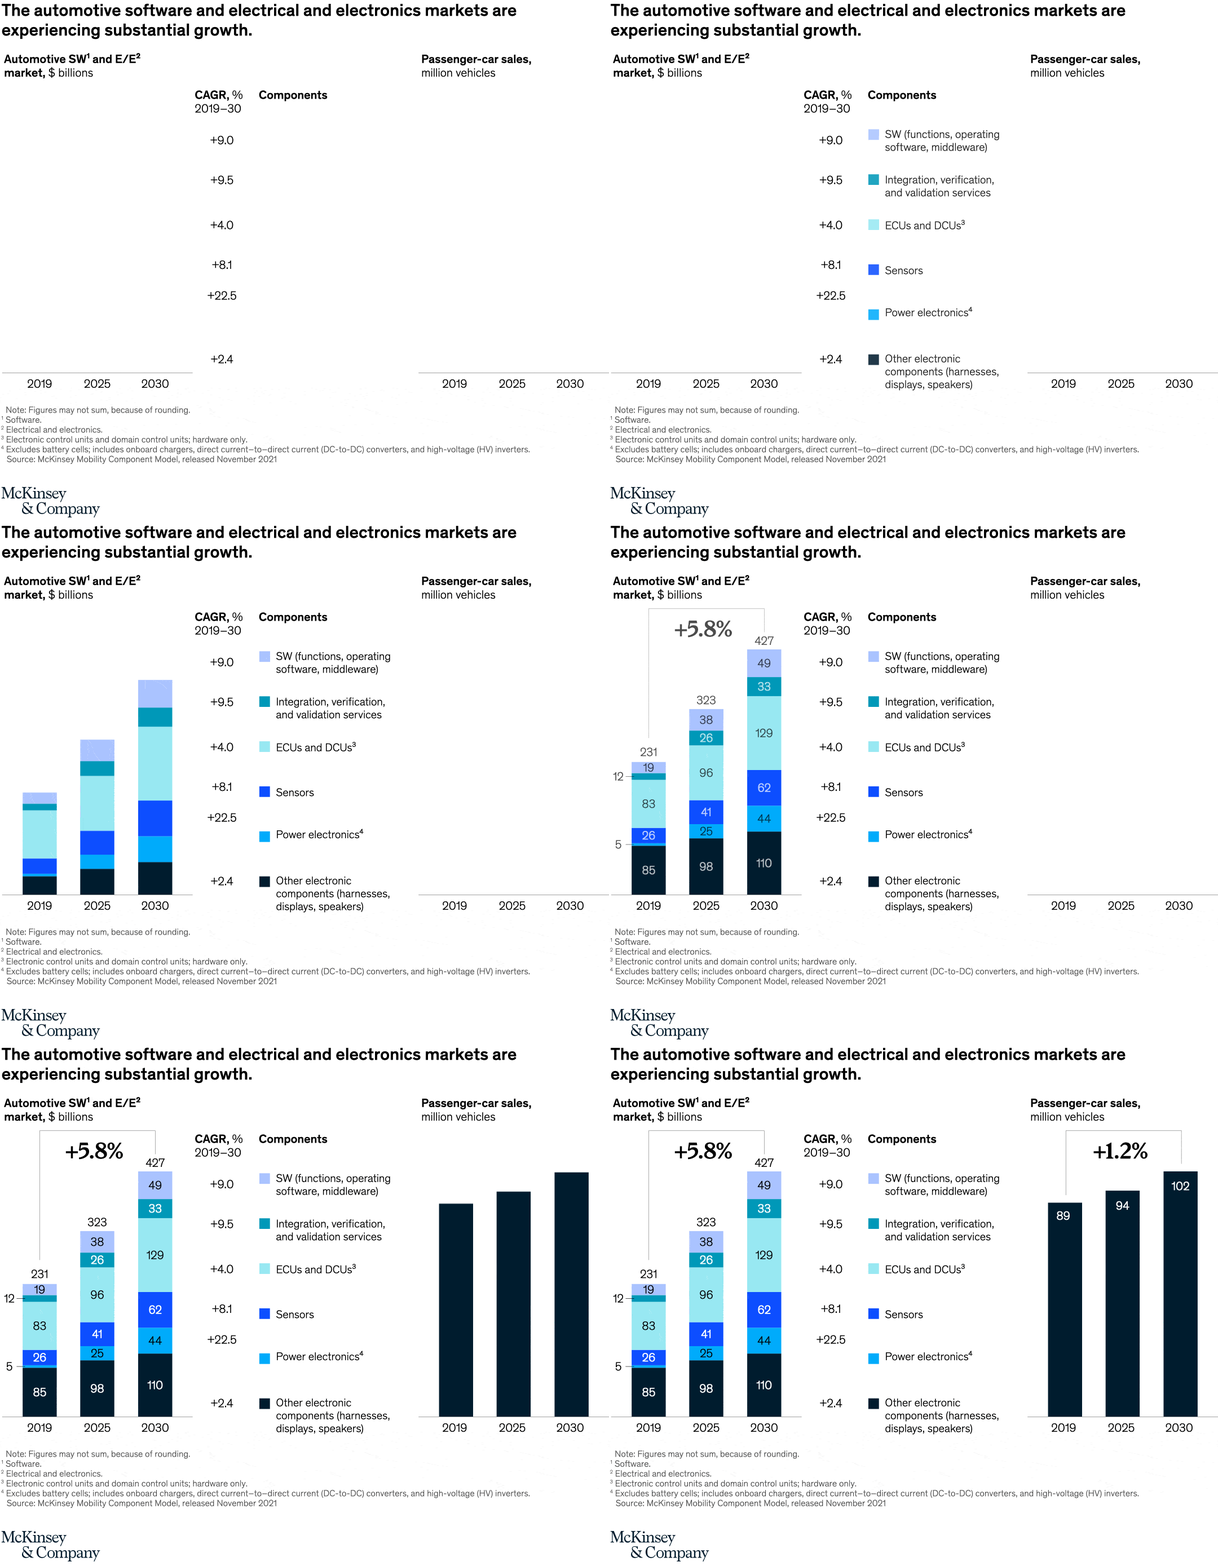
Stacked-column comparison chart with CAGR callouts and a companion sales column chart.
Layout / body structure
The chart is split into two coordinated sections. On the left, three stacked columns compare the automotive software and electrical-and-electronics market across 2019, 2025, and 2030; on the right, a simpler three-column chart shows passenger-car sales, while the center legend column lists the component categories and their CAGR values.
What is being compared
The left side compares the size and mix of the automotive software and E/E market over time, broken into other electronic components, power electronics, sensors, ECUs and DCUs, integration and validation services, and software. The right side compares that growth with passenger-car sales over the same three dates.
Measurement system
The market stacks are measured in billions of dollars, with totals printed above each year, while passenger-car sales are measured in millions of vehicles. The middle callout column adds CAGR percentages from 2019 to 2030 for each component category, which lets the reader compare growth rates as well as absolute size.
Visible structure inside the graphic
The left stack uses six color bands inside each year’s column, so both the total height and the internal segment mix change over time. The center legend aligns each color to a named component and a CAGR value, and the right chart strips everything down to three dark columns so the slower sales-growth comparison reads as a separate benchmark.
Main takeaway from the visual
The automotive software and E/E market grows much faster than passenger-car sales, which means value expansion is coming from increasing electronics and software content per vehicle rather than from vehicle volumes alone. Within that growth, power electronics and integration-related layers expand especially quickly relative to the more mature component groups.
Key standout values or extremes
The total software and E/E market rises from 231 billion dollars in 2019 to 323 billion in 2025 and 427 billion in 2030, while passenger-car sales move only from 89 million to 94 million to 102 million. Among the listed CAGR values, power electronics is highest at 22.5 percent, integration, verification, and validation services is 9.5 percent, software is 9.0 percent, sensors are 8.1 percent, ECUs and DCUs are 4.0 percent, and other electronic components are 2.4 percent.
Controls / sequence, when applicable
This is a static chart image with no in-chart controls to operate.
Companion media, when applicable
There is no separate companion audio or video; the chart image is the full visual on this page.