Source page: McKinsey & Company
Commentary
Hanging tough
Advanced industries
November 2, 2022 – Resilient players in the distribution industry could emerge from these volatile times with a strategic advantage against competitors. Based on analysis by senior partner Kevin Sachs and colleagues of how industrial distributors performed through the Great Recession and during the recovery, from 2007 to 2011, outperformers experienced lower drops in margin during the downturn compared with nonresilient companies. Resilient distributors tended to focus on profitable growth during the slowdown and exhibited a heavy emphasis on category management.
To read the article, see “How distributors can build momentum in a slowdown,” September 20, 2022.
customizer here
Visual form
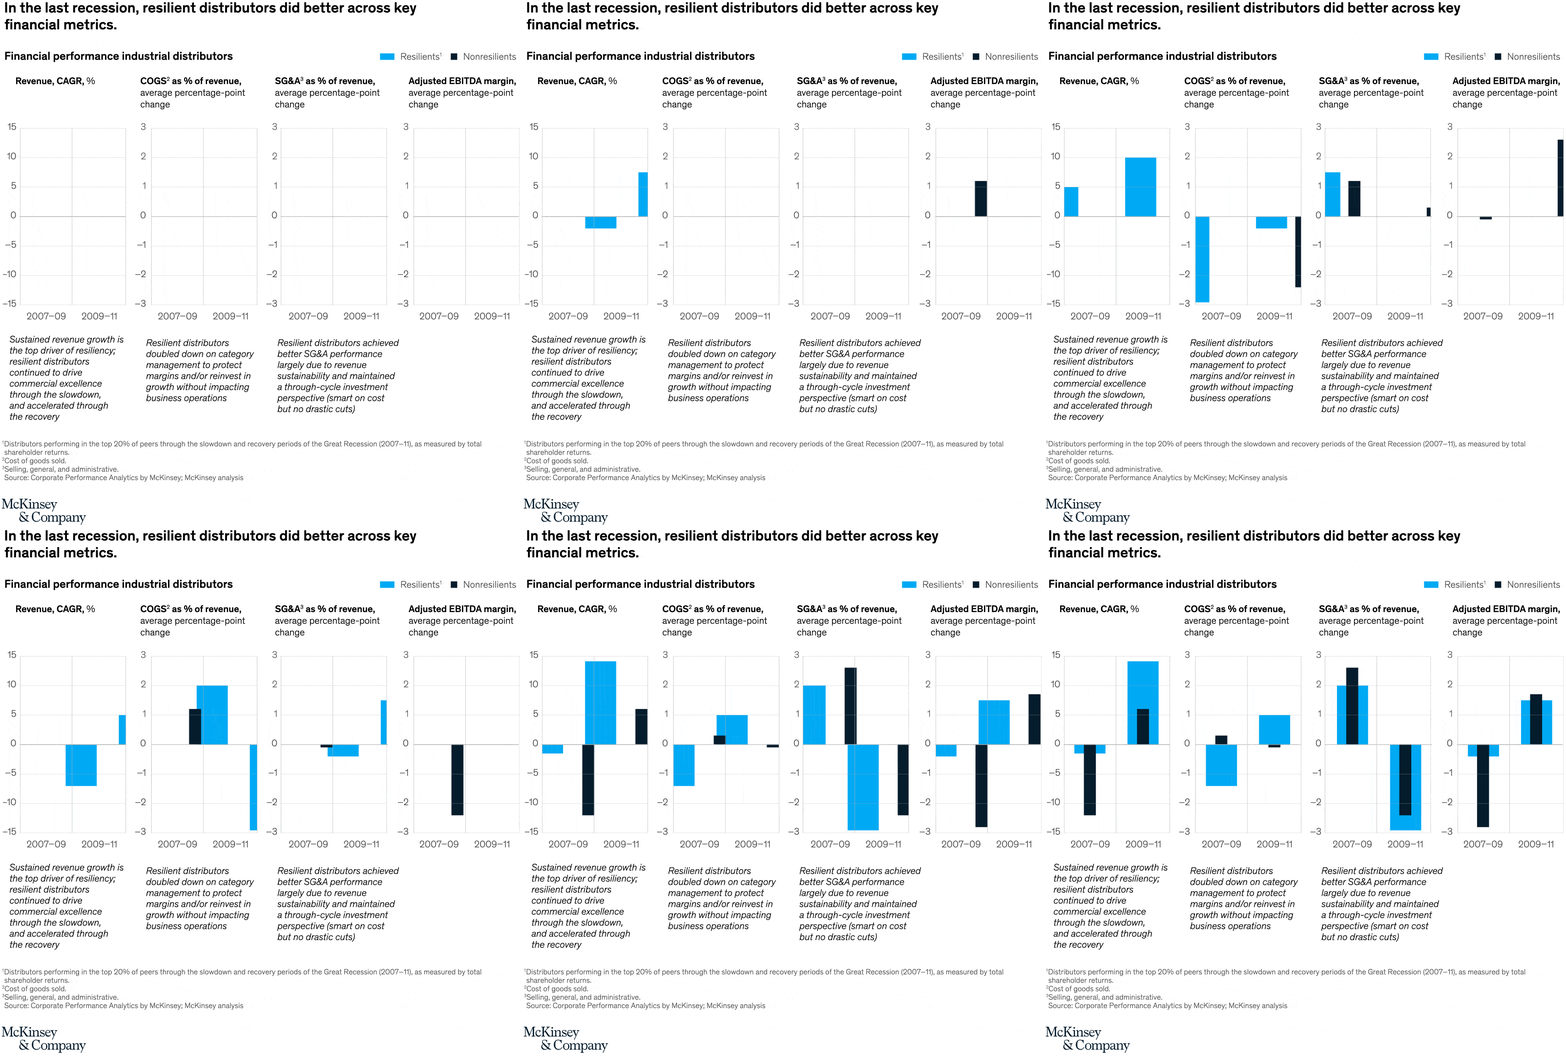
Financial-metrics comparison chart.
Layout / body structure
The chart is laid out as a side-by-side comparison of resilient distributors and nonresilient distributors through the downturn and recovery period. Reader moves across a small set of key financial metrics rather than through a long time series.
What is being compared
It compares how resilient and nonresilient industrial distributors performed across the Great Recession and the following recovery on core financial measures.
Measurement system
The chart uses financial performance measures such as margin change, recovery strength, and related business metrics. The values are comparative rather than purely descriptive, so the key reading is how one group outperforms the other.
Visible structure inside the graphic
The main internal pieces are the paired metric comparisons for the two distributor groups, arranged so the resilient players and the nonresilient players can be read against each other directly. The grouped bars or markers make the gap visible across several measures at once.
Main takeaway from the visual
The page shows that resilience pays off not only after the downturn but during it. The resilient distributors give up less margin in the decline and then widen the gap again as the recovery starts.
Key standout values or extremes
The strongest visual contrast is that resilient distributors experience smaller margin declines in the recession and stronger recovery performance afterward. The chart is built around that repeated edge across the key financial metrics.
Controls / sequence, when applicable
This is a static chart image with no in-chart controls to operate.
Companion media, when applicable
There is no separate companion audio or video; the chart image is the full visual on this page.