Source page: McKinsey & Company
Commentary
Hardest-hit European export industries bounced back fastest from last recession
COVID-19 | Reopening | Europe
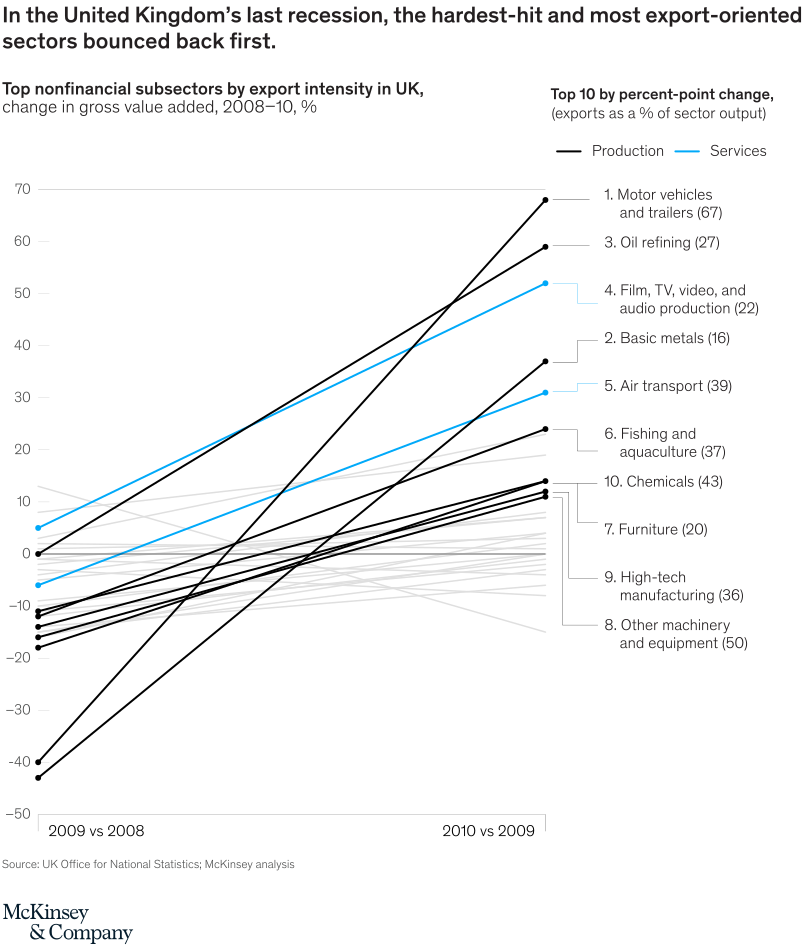
May 18, 2020 – Past isn’t necessarily prologue, but as just one example, almost all export subsectors in the United Kingdom grew more in 2010 than they lost in 2009.
To read the article, see “How European businesses can position themselves for recovery,” April 2020.
customizer here
Visual form
Slope-style multi-line chart with ranked sector labels on the right.
Layout / body structure
Each line connects a sector’s 2009 decline against its 2010 rebound. Blue lines highlight selected sectors while gray lines provide the broader sector context.
What is being compared
It compares UK financial and business-related subsectors by export intensity and gross-value-added change around the last recession, showing which sectors fell hardest and then rebounded fastest.
Measurement system
The vertical scale is percent change in gross value added from 2008 to 2010. The right-side labels rank sectors by percent-point change and include export share as a percent of sector output.
Visible structure inside the graphic
Many lines rise steeply from negative 2009 positions to positive 2010 positions. Several export-intensive sectors climb to the top of the right-side ranking, making the rebound pattern visible.
Main takeaway from the visual
The sectors hit hardest in the downturn were also among the fastest to bounce back, which is why the chart emphasizes steep upward line segments rather than a simple before-after bar comparison.
Key standout values or extremes
Motor vehicles and trailers, oil refining, and film, TV, video, and audio production appear near the top of the rebound list. Air transport also shows a sharp recovery path after a deep decline.
Controls / sequence, when applicable
This is a static chart image with no in-chart controls to operate.
Companion media, when applicable
There is no separate companion audio or video; the chart image is the full visual on this page.