Source page: McKinsey & Company
Commentary
Have it your way
COVID-19 | Remote work
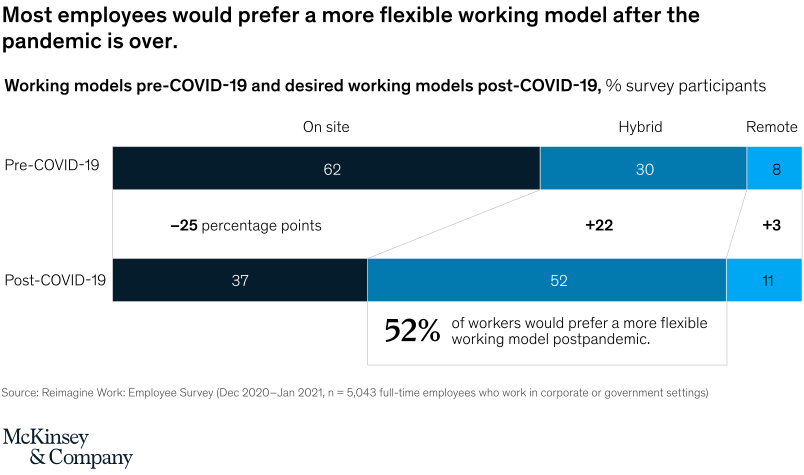
June 7, 2021 – How can organizations help their anxious and burned-out employees? More than half of employees told us they would like their companies to adopt more flexible hybrid virtual-working models.
To read the article, see “What employees are saying about the future of remote work,” April 1, 2021.
customizer here
Visual form
Two-row stacked-bar comparison with bridge annotations.
Layout / body structure
The chart uses one stacked horizontal bar for the pre-COVID-19 working model and one for the desired post-COVID-19 working model. Read the top row first, then the bottom row, and use the connecting guide lines and the annotated percentage-point changes in the middle to compare how on-site, hybrid, and remote shares shift between the two rows.
What is being compared
The chart compares employees’ actual working-model mix before COVID-19 with the working-model mix they would prefer after the pandemic. It compares the shares of workers in on-site, hybrid, and remote arrangements across those two moments.
Measurement system
Each bar is a 100-percent stack split into on-site, hybrid, and remote segments, with the exact percentages printed inside the segments. The middle annotations summarize the shift in percentage points from the first row to the second, and the boxed callout reinforces the headline preference for hybrid work.
Visible structure inside the graphic
The top row is dominated by a large dark on-site segment, while the bottom row expands the medium-blue hybrid segment and slightly enlarges the light-blue remote segment. Thin connector lines link the segment boundaries between rows so the transition from pre-COVID to preferred post-COVID layout is easy to trace visually.
Main takeaway from the visual
Employees want a much more flexible working model after the pandemic, driven mainly by a large shift from on-site work to hybrid work rather than to fully remote work. The chart makes that clear because the on-site share drops sharply while hybrid becomes the largest segment in the preferred future state.
Key standout values or extremes
Pre-COVID-19, the mix is 62 percent on site, 30 percent hybrid, and 8 percent remote. In the desired post-COVID-19 model, it becomes 37 percent on site, 52 percent hybrid, and 11 percent remote. The annotations quantify that as minus 25 percentage points for on-site work, plus 22 for hybrid, and plus 3 for remote.
Controls / sequence, when applicable
This is a static chart image with no in-chart controls to operate.
Companion media, when applicable
There is no separate companion audio or video; the chart image is the full visual on this page.