Source page: McKinsey & Company
Commentary
Heads up
Economy | Jobs
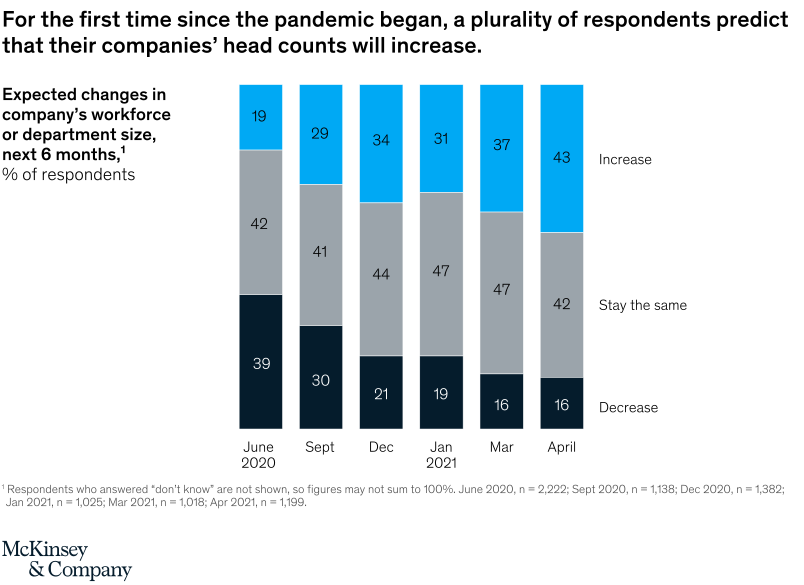
May 24, 2021 – Optimism is on the rise. In our latest McKinsey Global Survey on the economy, 43 percent of respondents feel their companies will increase head count within the next six months. It’s the first time since the pandemic began that a majority of respondents have expressed this sentiment.
To read the survey, see “The coronavirus effect on global economic sentiment,” April 30, 2021.
customizer here
Visual form
Six-period stacked bar timeline.
Layout / body structure
The chart is a single row of six stacked columns running from June 2020 through April 2021. Read left to right across the months, using the consistent stack order and the side labels for increase, stay the same, and decrease to track how expectations shift over time.
What is being compared
The chart compares respondents’ expectations for changes in company or department workforce size over the next six months at six survey points. It compares the shares expecting head count to decrease, stay the same, or increase from June 2020 to April 2021.
Measurement system
Each column is a 100-percent stack, so the measure is the percent of respondents in each expectation category. The dark bottom segment represents decrease, the gray middle segment represents staying the same, and the blue top segment represents increase, with values printed directly inside the stacks.
Visible structure inside the graphic
All six columns share the same stacked order, which makes the shrinking dark decrease segment and growing blue increase segment easy to follow over time. The right-edge labels define the three stack meanings, and the final April column visually stands out because the blue segment becomes the largest single segment on the page.
Main takeaway from the visual
By April 2021, expectations had shifted enough that a plurality of respondents predicted head-count increases for the first time since the pandemic began. The progression across the six bars shows a steady fade in decline expectations and a corresponding rise in increase expectations, with the crossover becoming visible at the end of the sequence.
Key standout values or extremes
In June 2020, 39 percent expected a decrease, 42 percent expected no change, and only 19 percent expected an increase. By April 2021, the pattern shifts to 16 percent decrease, 42 percent stay the same, and 43 percent increase. The intermediate bars trace that climb: increases move from 29 percent in September to 34 in December, 31 in January, 37 in March, and then 43 in April while decreases fall from 30 to 21, 19, 16, and 16.
Controls / sequence, when applicable
This is a static chart image with no in-chart controls to operate.
Companion media, when applicable
There is no separate companion audio or video; the chart image is the full visual on this page.