Source page: McKinsey & Company
Commentary
Headwinds or a healthcare renaissance?
Healthcare | Economics
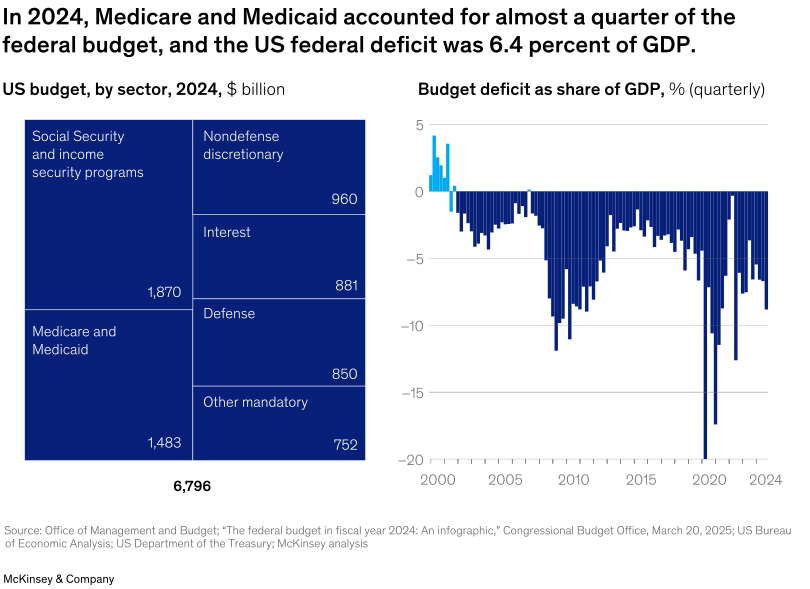
February 3, 2026 – Still recovering from the COVID-19 pandemic, the US healthcare industry now faces new pressures from tectonic shifts in the trade, economic, and security order. Healthcare sits squarely on the fault line of these shifts. In 2024, the US federal budget totaled $6.8 trillion, and the federal deficit was 6.4 percent of GDP—well above sustainable levels. With Medicare and Medicaid accounting for approximately 22 percent of the 2024 federal budget, healthcare is likely to face continued pressure. Yet the opportunity to improve healthcare outweighs the headwinds if leaders can successfully tap into advances in AI, automation, efficient sites of care, medical science, and care model innovation, say McKinsey’s Drew Ungerman, Jason Azzoparde, Shubham Singhal, and coauthor.
To read the article, see “Future of US healthcare: Gathering storm 2.0 or a golden age?,” November 18, 2026.
customizer here
Visual form
Two-panel mixed chart with a treemap on the left and a vertical bar chart on the right.
Layout / body structure
The visual is laid out in two side-by-side panels. It reads left to right, starting with the composition of the 2024 US budget and then moving to the time series of the federal deficit as a share of GDP.
What is being compared
The left panel compares major federal budget sectors in 2024, while the right panel compares quarterly budget deficit levels from 2000 through 2024. Together the two panels compare the scale of healthcare spending inside the budget with the broader fiscal pressure shown over time.
Measurement system
Budget categories on the left are measured in billions of dollars, and the right-hand panel measures the deficit as a percentage of GDP. The treemap uses rectangle size and embedded values to show relative budget weight, while the right panel uses a zero line and bar depth to show how far quarterly deficits fall below balance.
Visible structure inside the graphic
The left panel is built from labeled budget blocks for Social Security and income security programs, Medicare and Medicaid, nondefense discretionary spending, interest, defense, and other mandatory spending, with a total printed underneath. The right panel is a long run of vertical blue bars around a zero baseline, making the major deficit swings and troughs easy to spot across the full timeline.
Main takeaway from the visual
The visual makes two things clear at once: healthcare already occupies a very large block of the federal budget, and the overall fiscal backdrop remains deeply negative. Medicare and Medicaid sit among the largest spending categories, while the deficit panel shows repeated periods of substantial imbalance rather than a stable return to zero.
Key standout values or extremes
The 2024 budget total is shown as $6,796 billion, with Medicare and Medicaid at $1,483 billion, or almost a quarter of the total. On the right, the 2020 period produces the deepest negative deficit bars in the series, and the page text anchors 2024 at a 6.4 percent deficit-to-GDP level.
Controls / sequence, when applicable
This is a static chart image with no in-chart controls to operate.
Companion media, when applicable
There is no separate companion audio or video; the chart image is the full visual on this page.