Source page: McKinsey & Company
Commentary
Health in a changing climate
Climate change | Healthcare
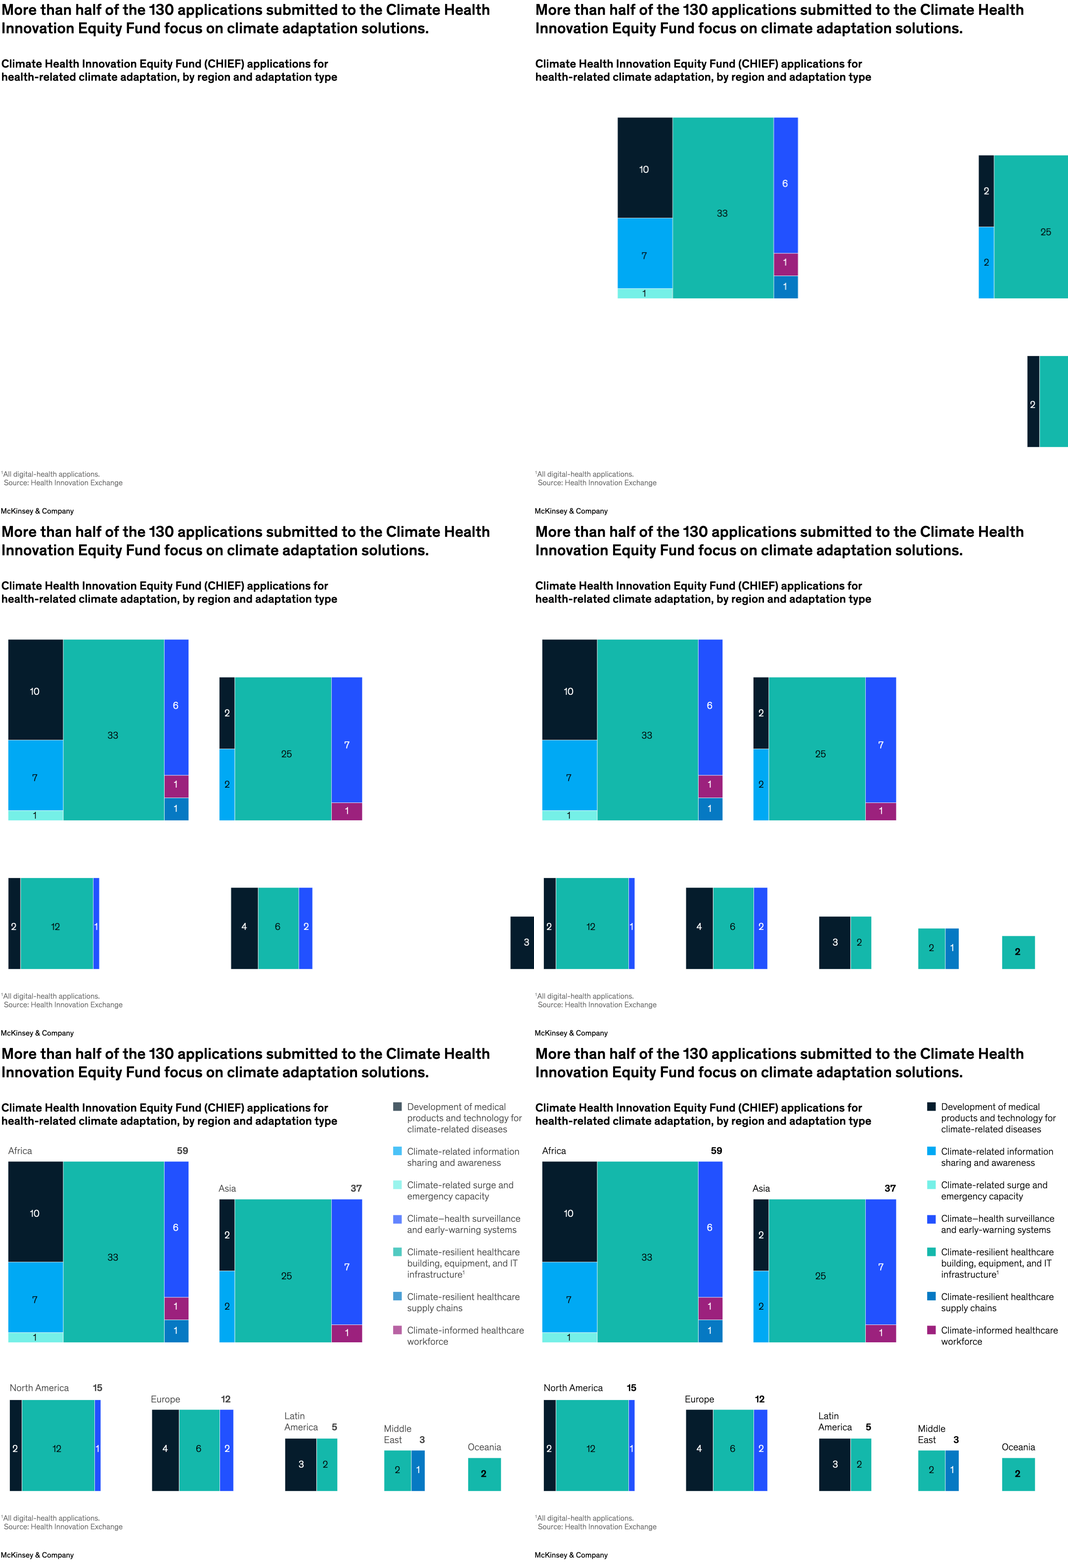
October 9, 2024 – The World Health Organization has called climate change “the greatest threat to global health in the 21st century.” Besides mitigation, adaptation—that is, dealing with existing or forecasted climate effects—is a pressing mandate, say senior partner Hemant Ahlawat and coauthors. Others seem to agree: the Health Innovation Exchange’s Climate Health Innovation Equity Fund’s call for solutions that address climate change sparked more than 80 adaptation-related applications, out of 130-plus received. These submitted innovations included medical products, surveillance and response systems, and healthcare infrastructure, supply chain, and workforce capabilities.
To read the article, see “Health-related climate adaptation: How to innovate and scale global action for local needs,” August 20, 2024.
customizer here
Visual form
Small-multiple stacked bar chart sequence.
Layout / body structure
The chart is arranged as a regional set of stacked blocks, with the largest regions shown in bigger panels at the top and smaller regional panels spread below. It is read from the large Africa and Asia panels first and then across the smaller regional totals, with the category legend positioned on the right.
What is being compared
It compares Climate Health Innovation Equity Fund application counts by region and by adaptation type, showing both how many applications came from each geography and what kind of climate-health solution they emphasized.
Measurement system
The reader tracks application counts rather than percentages. Totals for each region are printed above the stacked blocks, individual segment counts are printed inside many of the colored sections, and the legend maps each color to an adaptation category.
Visible structure inside the graphic
Each region is represented by a stacked rectangular block whose colored segments correspond to specific adaptation types. Africa and Asia dominate the layout with the tallest stacks, while North America, Europe, Latin America, the Middle East, and Oceania appear as smaller regional blocks beneath them.
Main takeaway from the visual
The visual weight sits in Africa and Asia, and within those regions the largest segments belong to climate-resilient healthcare building, equipment, and IT infrastructure. The chart makes both the geographic concentration of applications and the dominance of adaptation-oriented infrastructure proposals immediately visible.
Key standout values or extremes
Africa has the largest total at 59 applications and Asia follows at 37, compared with 15 for North America and 12 for Europe. The climate-resilient building, equipment, and IT infrastructure segment reaches 33 in Africa and 25 in Asia, while Oceania is the smallest regional block at just 2 applications.
Controls / sequence, when applicable
This is a static chart image with no in-chart controls to operate.
Companion media, when applicable
There is no separate companion audio or video; the chart image is the full visual on this page.