Source page: McKinsey & Company
Commentary
Help (really really) wanted
Strategy | Economy
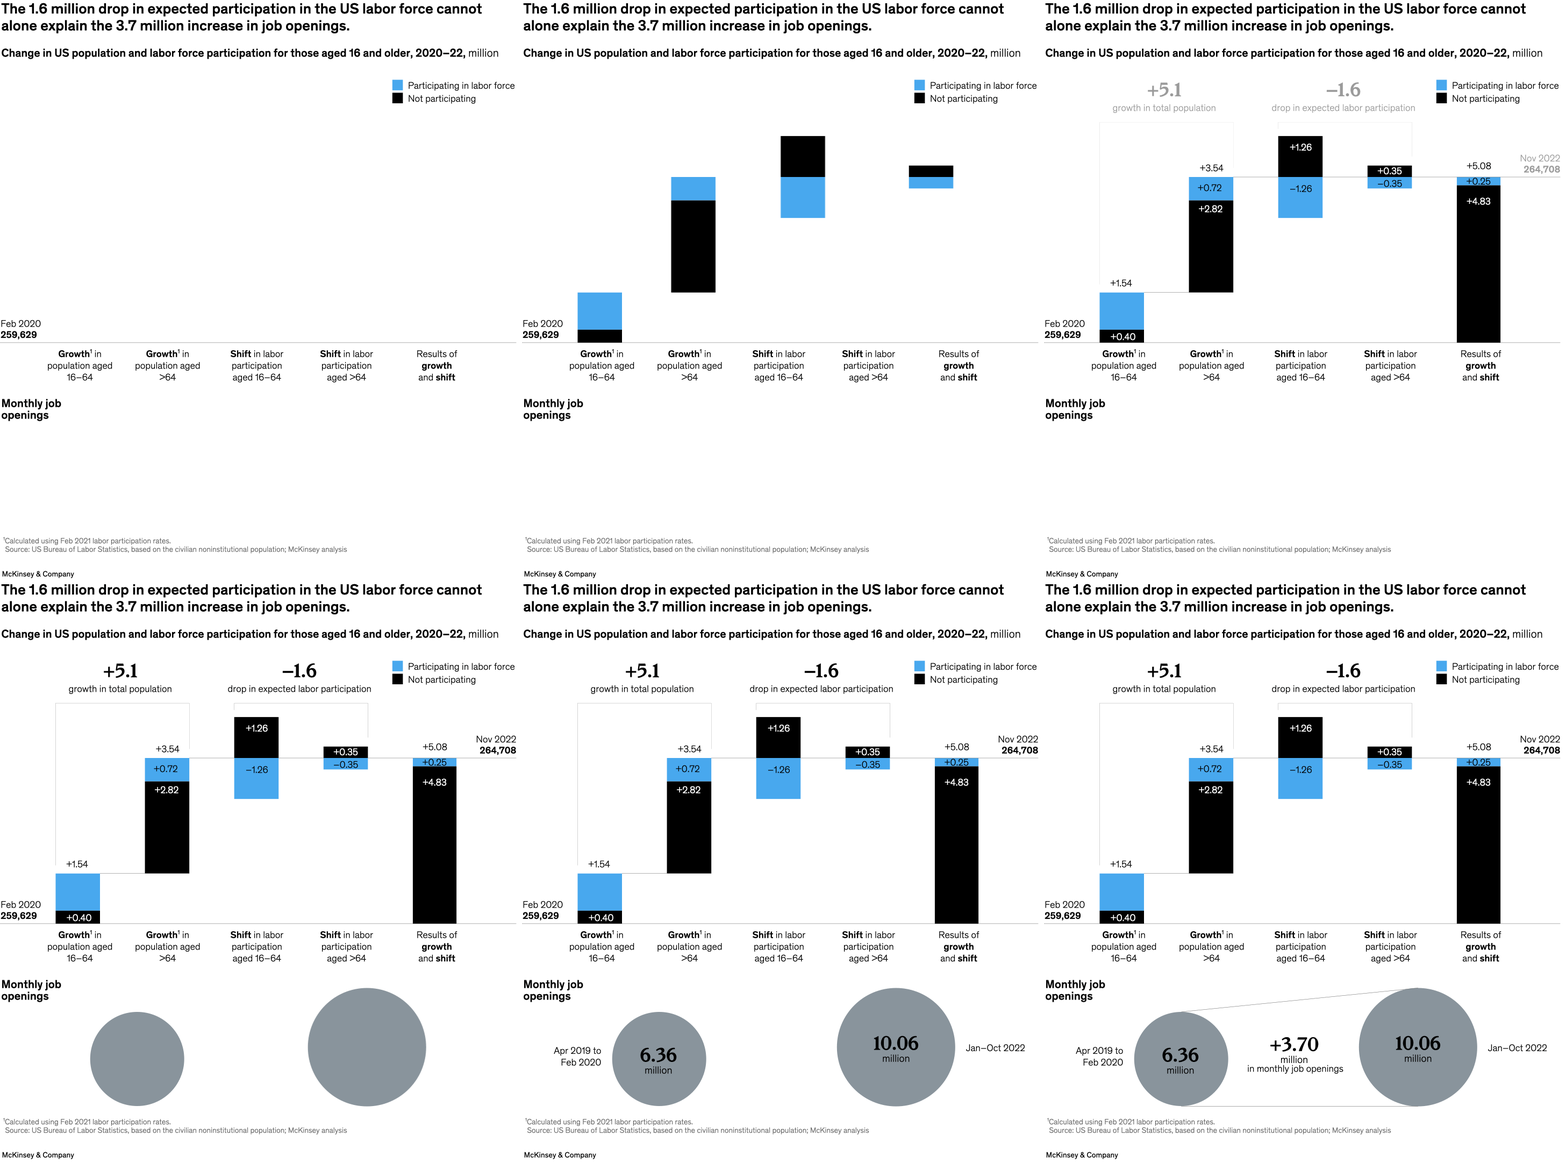
February 15, 2023 – The labor market continues to be one of the big riddles of the postpandemic era, find chair of insights and ecosystems and chair of McKinsey Global Institute Sven Smit and colleagues. A drop in labor force participation by roughly 1.6 million explains some of the US labor market tightness, but it doesn’t account for a 3.7 million spike in monthly job openings (compared with the earlier days of the pandemic). Contributing factors include an aging population, a jobs–skills mismatch, and more workers reevaluating what they want from a job—and from life.
To read the article, see “2023, a testing year: Will the macro-scenario range widen or narrow?,” January 16, 2023.
customizer here
Visual form
Waterfall chart with bubble comparison.
Layout / body structure
The upper half of the page is a waterfall showing population growth and labor-force-participation shifts, and the lower half adds two large circles comparing monthly job openings before and after the pandemic shock.
What is being compared
It compares the change in the US population and labor-force participation from 2020 to 2022, and then compares monthly job openings across the same period.
Measurement system
The waterfall values are measured in millions of people, and the opening comparison is also measured in millions, with the circles labeled directly.
Visible structure inside the graphic
The waterfall uses positive and negative stacked columns to show growth among older and younger groups and the losses from reduced labor-force participation. Below it, two large circles summarize monthly job openings at the start and later period, with a text callout between them for the change.
Main takeaway from the visual
The chart shows that reduced labor-force participation explains part of labor-market tightness, but not nearly all of the jump in job openings. The two layers of the graphic are designed to show that the vacancy spike is larger than the participation decline alone would suggest.
Key standout values or extremes
The chart labels a 5.1 million increase in the population aged 16 and older but a 1.6 million drop in expected labor-force participation. Monthly job openings rise from 6.36 million to 10.06 million, a gain of 3.70 million openings.
Controls / sequence, when applicable
This is a static chart image with no in-chart controls to operate.
Companion media, when applicable
There is no separate companion audio or video; the chart image is the full visual on this page.