Source page: McKinsey & Company
Commentary
High hopes for cloud computing
Digital | Cloud | Artificial Intelligence
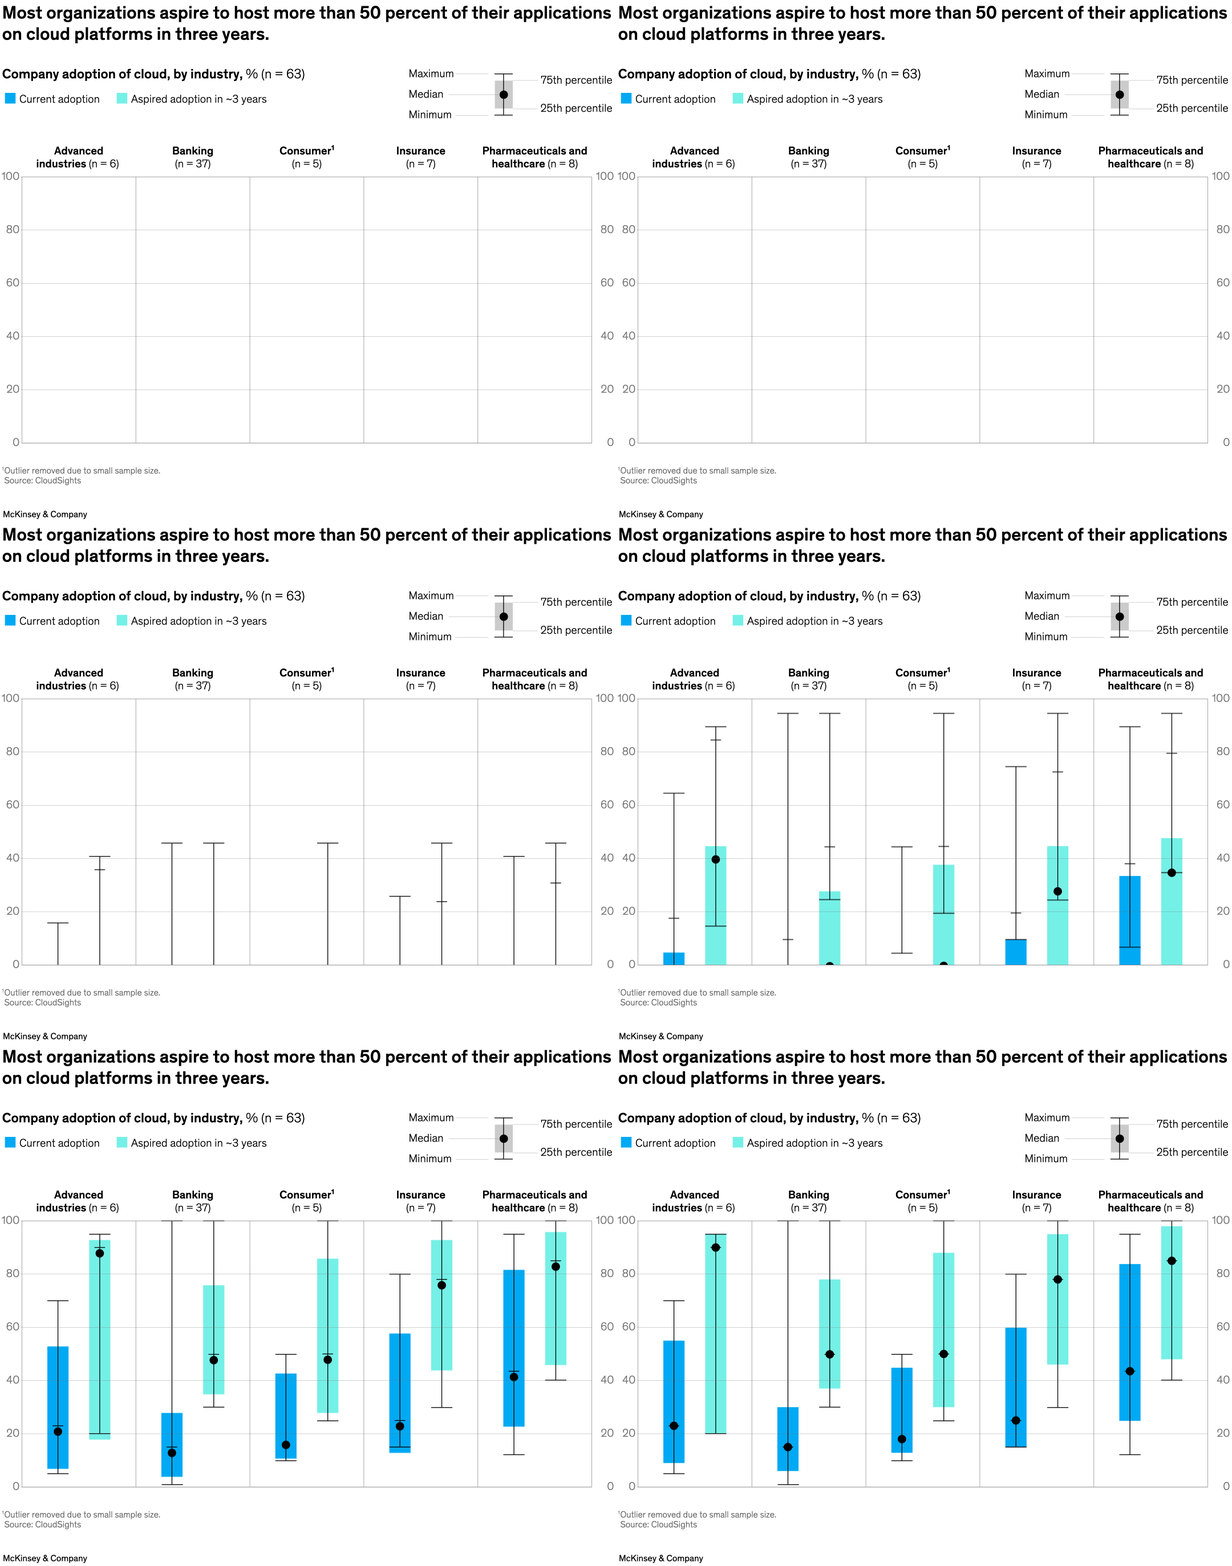
December 11, 2023 – Many leaders have high hopes for cloud computing, which can help organizations optimize IT costs and scale new technologies. But companies are often a long way from fulfilling those ambitions, according to senior partner Will Forrest and coauthors. Companies in North America aspire to have more than half of their applications running in the cloud (either via software as a service or the public cloud) within three to five years. However, with a few notable exceptions, most of the companies we profiled have achieved only a fraction of their aspirations for cloud adoption.
To read the report, see “In search of cloud value: Can generative AI transform cloud ROI?,” November 15, 2023.
customizer here
Visual form
Paired bar-and-range chart shown across industry columns. Each industry displays current cloud adoption next to aspired cloud adoption, with distribution markers showing the spread of responses inside the peer group.
Layout / body structure
The page lays out industries from left to right as separate vertical groupings. Within each grouping, a darker bar shows current adoption, a lighter bar shows aspired adoption in about three years, and a vertical whisker with a black marker shows the range and central tendency for that industry.
What is being compared
The visual compares cloud-adoption levels across industries such as advanced industries, banking, consumer, insurance, and pharmaceuticals and healthcare. It also compares present adoption against the level organizations say they want to reach in the next three years.
Measurement system
The unit is percentage of applications hosted in the cloud, and the vertical scale runs from zero toward 100. The legend distinguishes current adoption from aspired adoption, while the whisker elements flag minimum, lower quartile, median, upper quartile, and maximum where those statistics are shown.
Visible structure inside the graphic
Each industry column contains a dark current bar, a lighter target bar, and a slim vertical statistical marker. That combination lets the reader see not only the gap between current and target adoption but also how tightly clustered or widely spread company outcomes are inside each industry.
Main takeaway from the visual
Most organizations want a much larger share of their applications in the cloud than they have today. The chart makes that aspiration gap obvious because the lighter target bars sit well above the darker current bars in nearly every industry, even where current adoption is already relatively high.
Key standout values or extremes
Several industries show aspiration levels above the 50 percent mark, and advanced industries and pharmaceuticals and healthcare push particularly high on the target side. Banking starts from one of the lower current positions but still shows a large gap between where companies are now and where they say they want to be in roughly three years.
Controls / sequence, when applicable
This is a static chart image with no in-chart controls to operate.
Companion media, when applicable
There is no separate companion audio or video; the chart image is the full visual on this page.