Source page: McKinsey & Company
Commentary
High-tech solutions for the net-zero equation
Sustainability | Decarbonization
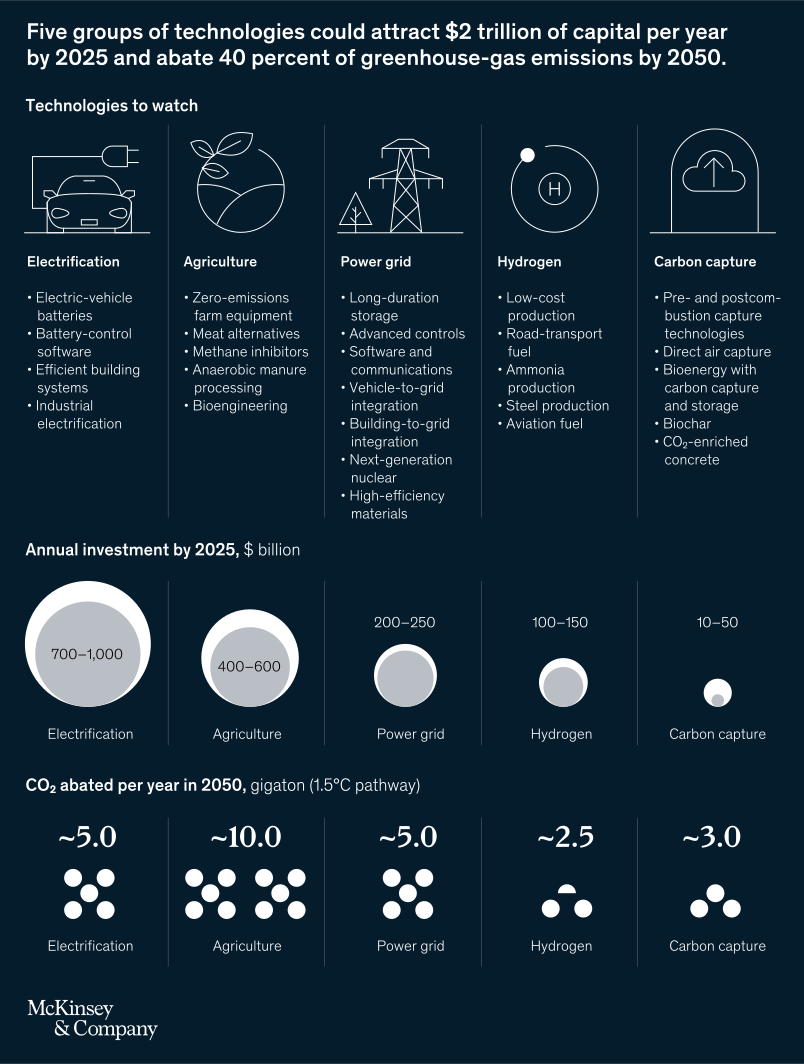
December 17, 2021 – Advanced technologies are key to decarbonization, and there are climate-technology needs that have yet to be realized. Next-generation technologies in five areas—agriculture, carbon capture, electrification, hydrogen, and the power grid—could reduce 40 percent of greenhouse-gas emissions by 2050 and could draw as much as $2 trillion in annual investments in the next few years.
To read the article, see “Innovating to net zero: An executive’s guide to climate technology,” October 28, 2021.
customizer here
Visual form
Five-column infographic comparison chart.
Layout / body structure
The chart is built as a single tall poster with five vertical columns running left to right for electrification, agriculture, power grid, hydrogen, and carbon capture. Reader takes each technology column from top to bottom: title and icon, bullet list of technologies to watch, investment bubble, and then the CO2-abatement row below.
What is being compared
The graphic compares five technology groups that could drive decarbonization. For each group it compares the kinds of technologies included, the annual capital they could attract by 2025, and the amount of CO2 they could abate per year in 2050.
Measurement system
The middle row measures annual investment by 2025 in billions of dollars and uses labeled bubble sizes to show range estimates. The bottom row measures CO2 abated per year in 2050 in gigatons on a 1.5 degrees Celsius pathway, while the headline frames the total opportunity as 2 trillion dollars of capital per year and 40 percent of greenhouse-gas emissions abated by 2050.
Visible structure inside the graphic
Each of the five columns begins with a line icon and a short bullet list of representative technologies, then a bubble labeled with its investment range, then a numeric abatement figure with a dot cluster beneath it. The size progression is visibly largest for electrification and agriculture, smaller for power grid and hydrogen, and smallest for carbon capture.
Main takeaway from the visual
Electrification and agriculture dominate the opportunity set, with power grid, hydrogen, and carbon capture adding meaningful but smaller contributions. The layout makes the page read like a ranked field of technology bets, where a small number of groups carry most of the capital demand and most of the abatement potential.
Key standout values or extremes
Electrification is labeled at 700 to 1,000 billion dollars of annual investment and about 5.0 gigatons of annual abatement, while agriculture is labeled at 400 to 600 billion dollars and about 10.0 gigatons. Power grid shows 200 to 250 billion and about 5.0 gigatons, hydrogen 100 to 150 billion and about 2.5 gigatons, and carbon capture 10 to 50 billion with about 3.0 gigatons.
Controls / sequence, when applicable
This is a static chart image with no in-chart controls to operate.
Companion media, when applicable
There is no separate companion audio or video; the chart image is the full visual on this page.