Source page: McKinsey & Company
Commentary
Holding back the waters
Climate change | Sustainability
December 20, 2023 – Accelerating climate change is giving rise to extreme weather events that could threaten the habitability of some of the planet’s most populated areas and force changes in many communities. In the face of this huge challenge, countries have developed national adaptation plans covering a wide range of responses. Managing partner for global client capabilities Homayoun Hatami and senior partner Hamid Samandari note that some measures offer benefits for both adaptation and the parallel effort to limit or reduce greenhouse gases. One example: a hectare of mangroves can store 1,000 tons of carbon on average, and at the same time prevent soil erosion and protect coastlines and infrastructure.
To read the article, see “Paving the way to resilience: Strengthening public sector adaptation planning and execution,” November 27, 2023.
customizer here
Visual form
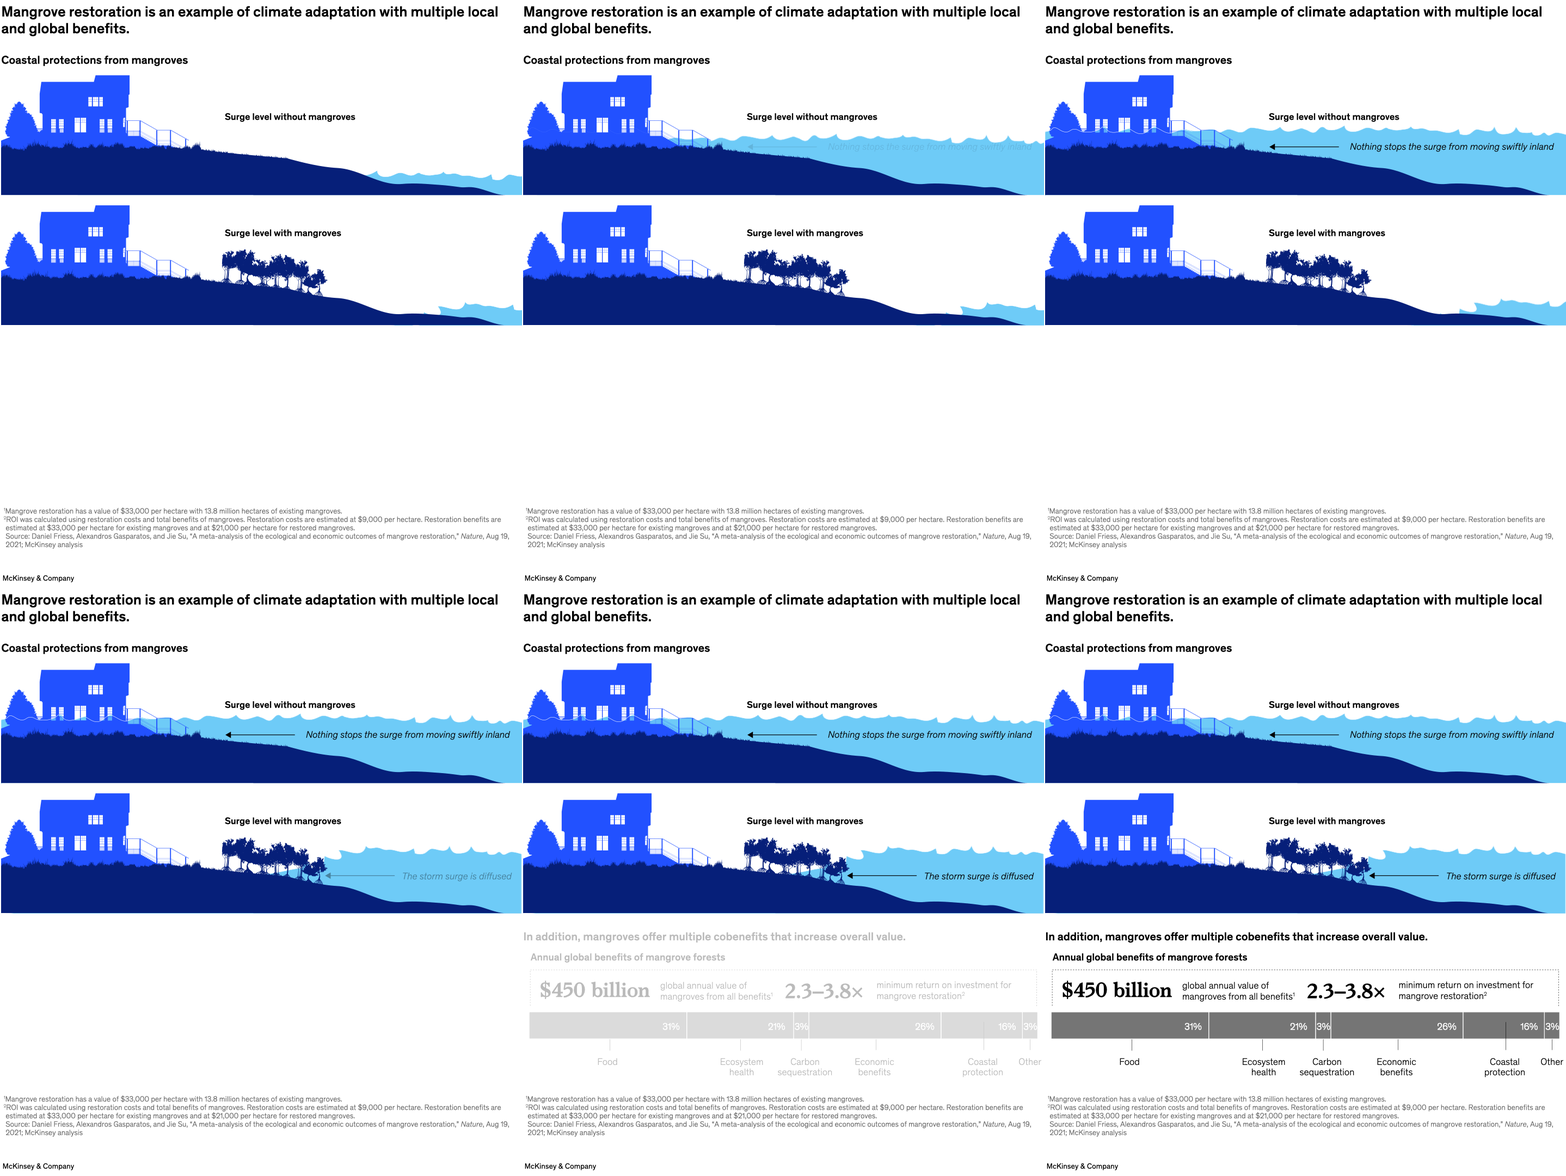
Multi-panel image sequence. The page combines an illustrated adaptation explainer with a quantified benefits section, so it works as both a conceptual diagram and an economic summary.
Layout / body structure
Layout / body structure: the upper portion contrasts coastlines without mangroves and with mangroves, and the lower portion shifts to benefit and return figures. The reading order is top to bottom, moving from physical coastal protection to the measured economic and environmental payoffs beneath it.
What is being compared
What is being compared: the visual compares exposed coastal conditions with mangrove-protected conditions and then compares the different categories of value created by mangrove restoration. It links a physical resilience story to a portfolio of climate, ecosystem, and economic benefits.
Measurement system
Measurement system: the chart mixes illustrated process cues with labeled economic and environmental figures. The reader is asked to track annual global benefits measured in billions of dollars, return on investment multiples, and carbon-storage quantities associated with mangrove ecosystems.
Visible structure inside the graphic
Visible structure inside the graphic: the upper panel uses side-by-side coastal scenes and directional water movement to show how mangroves diffuse storm surge, while the lower panel uses labeled totals and benefit categories to organize the payoff case. The shift from illustration to quantified summary gives the page a clear two-part anatomy.
Main takeaway from the visual
Main takeaway from the visual: mangrove restoration is shown as both a protective coastal barrier and a high-value climate adaptation investment. The page makes that dual role visible by pairing the before-and-after shoreline comparison with a second section that totals the financial and carbon-related benefits.
Key standout values or extremes
Key standout values or extremes: the chart states that annual global benefits of mangrove forests total 450 billion dollars and that the minimum return on investment is shown in a 2.3 to 3.8 times range. It also notes that one hectare of mangroves can store about 1,000 tons of carbon on average.
Controls / sequence, when applicable
This is a static chart image with no in-chart controls to operate.
Companion media, when applicable
There is no separate companion audio or video; the chart image is the full visual on this page.