Source page: McKinsey & Company
Commentary
Holiday shopping jitters?
Consumer | Retail
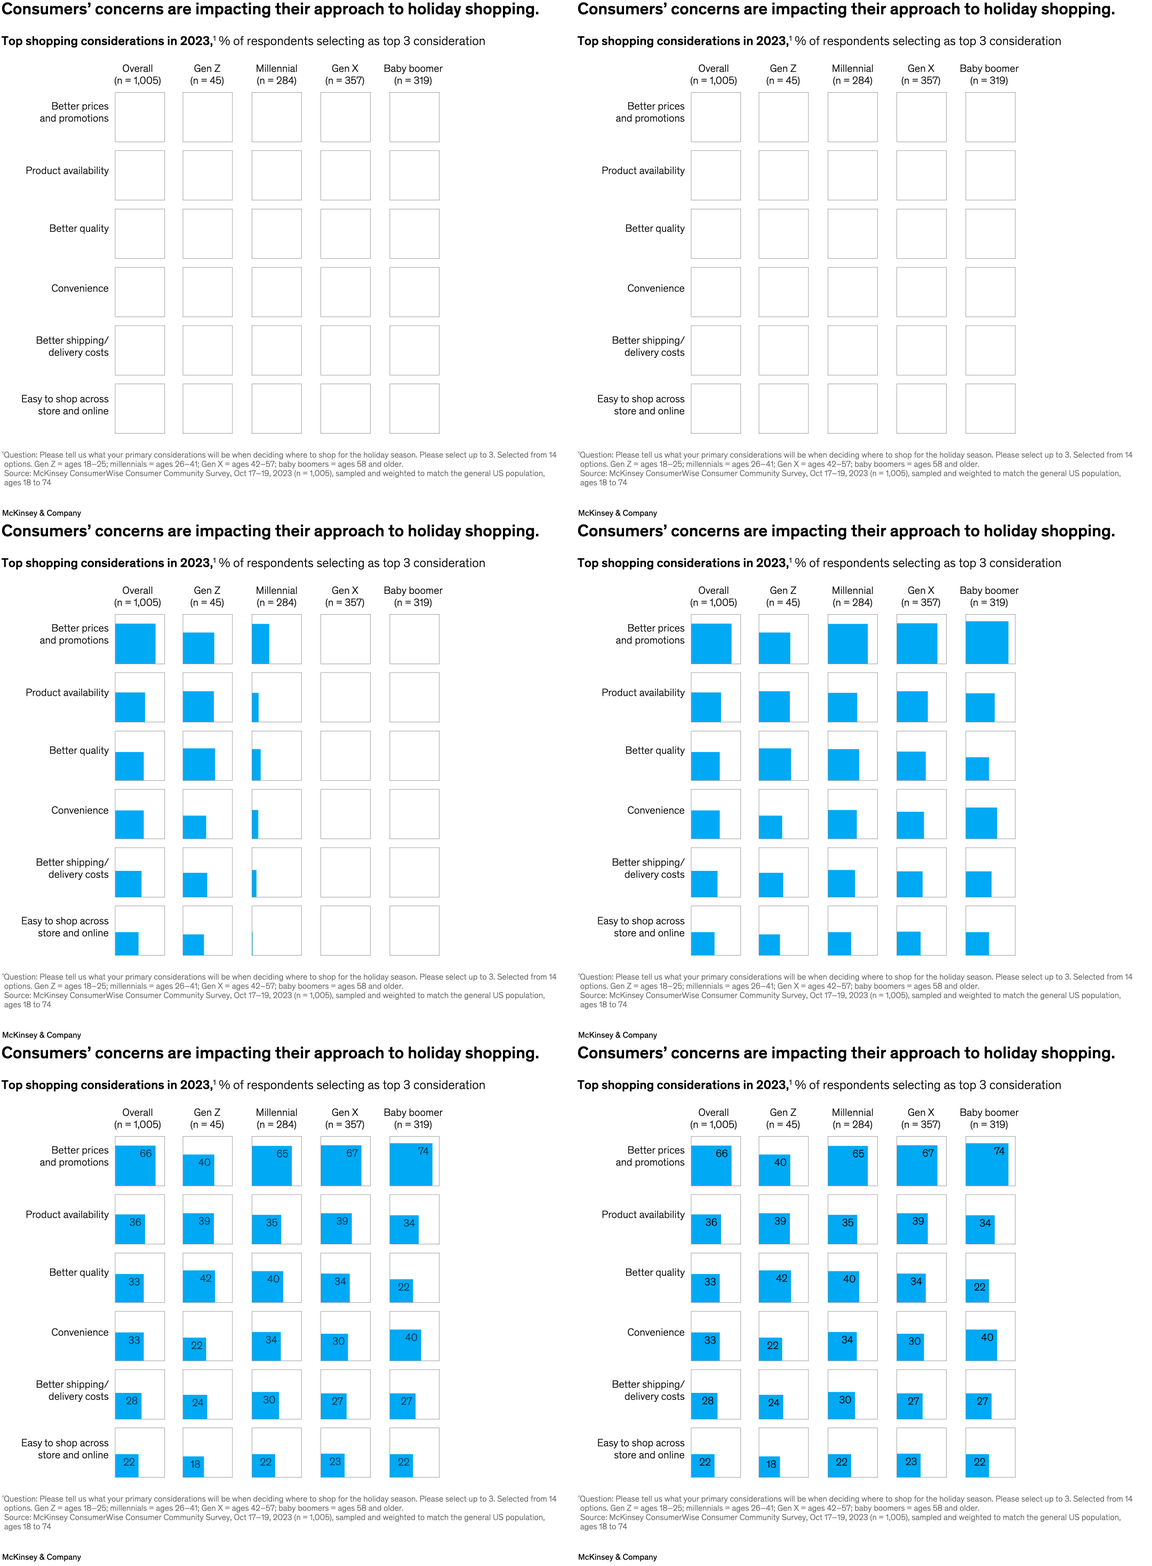
November 22, 2023 – Economic uncertainty and geopolitical issues are weighing on US consumers. How will it affect their holiday shopping? According to a survey by senior partner Kelsey Robinson and colleagues, 66 percent of consumers rank better prices and promotions as their top consideration in the holiday season, far outpacing product availability, convenience, and better quality. Concerns about prices are most pronounced among baby boomers, followed by Gen X and millennials.
To read the article, see “US holiday shopping 2023: Consumer caution and retailer resilience,” November 6, 2023.
customizer here
Visual form
Heatmap-style table. The chart uses numeric cells and color intensity instead of bars or lines to compare holiday-shopping priorities across generations.
Layout / body structure
The chart is organized as a matrix with shopping considerations in the rows and consumer groups in the columns. Reader moves top to bottom through priorities such as better prices and promotions, product availability, better quality, convenience, better shipping or delivery costs, and easy in-store and online returns, while comparing the values across overall consumers, Gen Z, millennials, Gen X, and baby boomers.
What is being compared
The visual compares which holiday-shopping considerations matter most to different generations. It is comparing preference strength across shopper cohorts, not tracking change over time, so the key question is which rows light up most strongly for which age groups.
Measurement system
The unit is percentage of respondents selecting each shopping consideration. Each cell contains the printed percentage, and the blue shading intensity helps the reader see which consideration is strongest within a column and which priorities weaken as the list moves downward.
Visible structure inside the graphic
The matrix is built from repeated numeric boxes, one for each row-and-column intersection, with darker cells marking stronger consumer emphasis. Because every generation sits in its own column, the reader can scan vertically for each cohort or horizontally to see where one consideration breaks differently across age groups.
Main takeaway from the visual
Price sensitivity dominates holiday shopping and outweighs the other considerations for every generation. The top row is clearly the darkest and highest-valued across the table, while the rest of the rows drop off, especially for considerations such as returns and delivery costs.
Key standout values or extremes
Better prices and promotions leads every column, with 66 percent overall, 68 percent for millennials, 67 percent for Gen X, and 74 percent for baby boomers. By contrast, easy in-store and online returns sits much lower across the table, with values clustered in the teens or low twenties.
Controls / sequence, when applicable
This is a static chart image with no in-chart controls to operate.
Companion media, when applicable
There is no separate companion audio or video; the chart image is the full visual on this page.