Source page: McKinsey & Company
Commentary
House proud
Economy
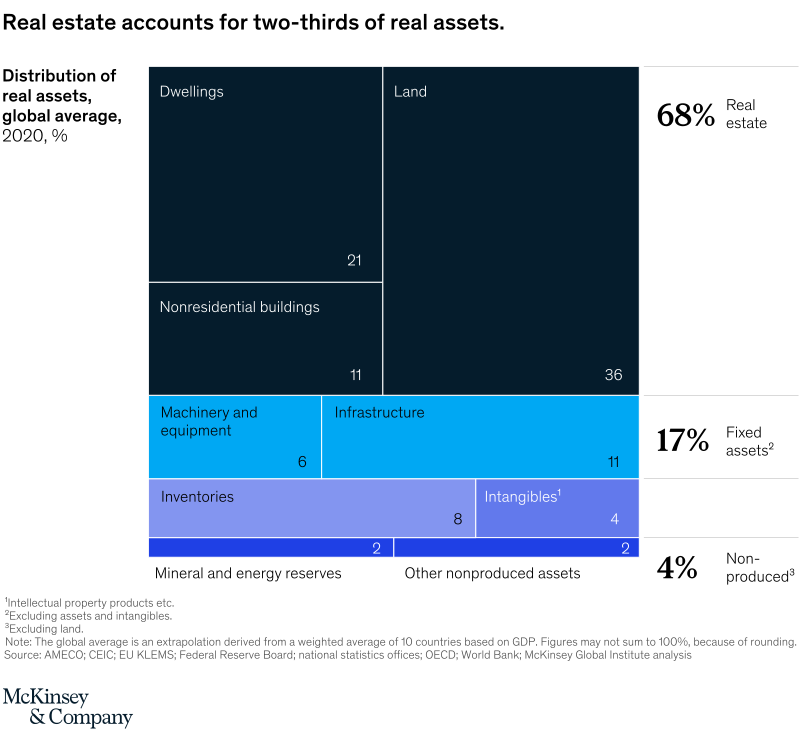
December 16, 2021 – McKinsey Global Institute’s new research proposes a new way of looking at the world’s wealth: the balance sheet. On that view, a notable finding is that, after tripling in value from 2000 to 2020, residential real estate amounted to nearly half of global net worth in 2020; corporate and government buildings and land accounted for about another quarter. Infrastructure, industrial structures, machinery and equipment, intangibles, and mineral reserves—the assets that typically drive economic growth—made up only one-fifth of real assets.
To read the article, see “The rise and rise of the global balance sheet: How productively are we using our wealth?,” November 15, 2021.
customizer here
Visual form
Treemap asset-allocation chart.
Layout / body structure
The chart is a single treemap with the area blocks packed into one large rectangle and the category rollups summarized on the right. Reader identifies the largest blocks first inside the treemap and then checks the right-side labels to see how those blocks aggregate into broader asset classes.
What is being compared
The chart compares the distribution of real assets in the global average for 2020. It breaks the total into dwellings, land, nonresidential buildings, machinery and equipment, infrastructure, inventories, intangibles, mineral and energy reserves, and other nonproduced assets.
Measurement system
Every block is measured as a percent share of total real assets. The treemap prints the larger values inside the blocks, and the right-hand labels summarize major group totals, including 68 percent for real estate, 17 percent for fixed assets, and 4 percent for non-produced assets.
Visible structure inside the graphic
The dark upper portion of the treemap holds the real-estate blocks, with land as the largest rectangle, dwellings next, and nonresidential buildings beneath them. Below that, a bright band splits machinery and equipment from infrastructure, and a lower band adds inventories, intangibles, mineral and energy reserves, and other nonproduced assets as progressively smaller rectangles.
Main takeaway from the visual
Real estate clearly dominates the balance sheet of real assets. The visual is built so that the land, dwellings, and nonresidential-building blocks occupy most of the page, making the two-thirds real-estate share obvious before the reader even reaches the right-side 68 percent label.
Key standout values or extremes
Land is the largest single block at 36 percent, followed by dwellings at 21 percent and nonresidential buildings at 11 percent, which together produce the 68 percent real-estate total. Outside real estate, infrastructure is 11 percent, inventories 8 percent, machinery and equipment 6 percent, intangibles 4 percent, and the two smallest bottom blocks are 2 percent each for mineral and energy reserves and other nonproduced assets.
Controls / sequence, when applicable
This is a static chart image with no in-chart controls to operate.
Companion media, when applicable
There is no separate companion audio or video; the chart image is the full visual on this page.