Source page: McKinsey & Company
Commentary
Housing a growing global 65+ population
Real estate | Innovation
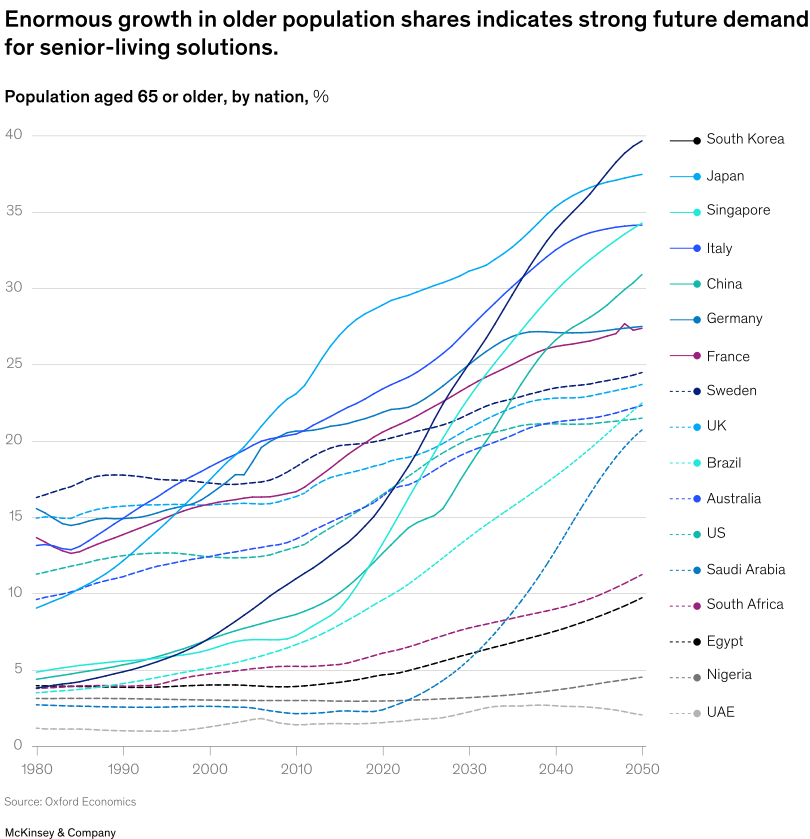
April 9, 2025 – The global population aged 65 and older is projected to increase dramatically in the coming decades, creating significant future demand for senior-living services, note Senior Partner Gunjan Khanna and coauthors. Globally, 80 percent of older adults want to live in their own homes, creating an opportunity for businesses.
To read the article, see “How private investment can improve senior-housing options,” March 6, 2025.
customizer here
Visual form
Multi-line chart.
Layout / body structure
The chart is a single chart with many country lines running across one shared plotting area and short source notes set beneath it. Read it left to right along the time axis from 2015 through 2050, then compare the vertical positions of the country lines at the far-right end of the chart.
What is being compared
It compares the share of each country’s population aged 65 or older across time. The countries are compared against one another over the same years so the reader can see which nations age fastest and which stay materially lower.
Measurement system
The chart is measured in percent, and the reader is tracking population share rather than absolute head count. The horizontal axis carries years, the vertical axis carries percentage values, and the legend identifies the national lines.
Visible structure inside the graphic
The graphic is organized around a dense bundle of colored trend lines, each tied to a country in the legend. The lines rise at different slopes, creating a visible separation between the steepest-aging countries at the top and the lower-growth countries that remain beneath them.
Main takeaway from the visual
The visible takeaway is that population aging accelerates sharply in several countries, with a small set of markets pulling far above the rest by midcentury. The lines for South Korea, Japan, Singapore, and Italy climb much faster than the lower group, making the future demand concentration easy to see in the chart itself.
Key standout values or extremes
South Korea finishes near 40 percent by 2050, while Japan also ends in the high 30s and Singapore and Italy sit well above many other countries. Nations such as Nigeria, Egypt, and several lower lines remain far below those top trajectories, creating a wide spread between the oldest and youngest population profiles.
Controls / sequence, when applicable
This is a static chart image with no in-chart controls to operate.
Companion media, when applicable
There is no separate companion audio or video; the chart image is the full visual on this page.