Source page: McKinsey & Company
Commentary
How do you view inflation?
Consumer | Inflation
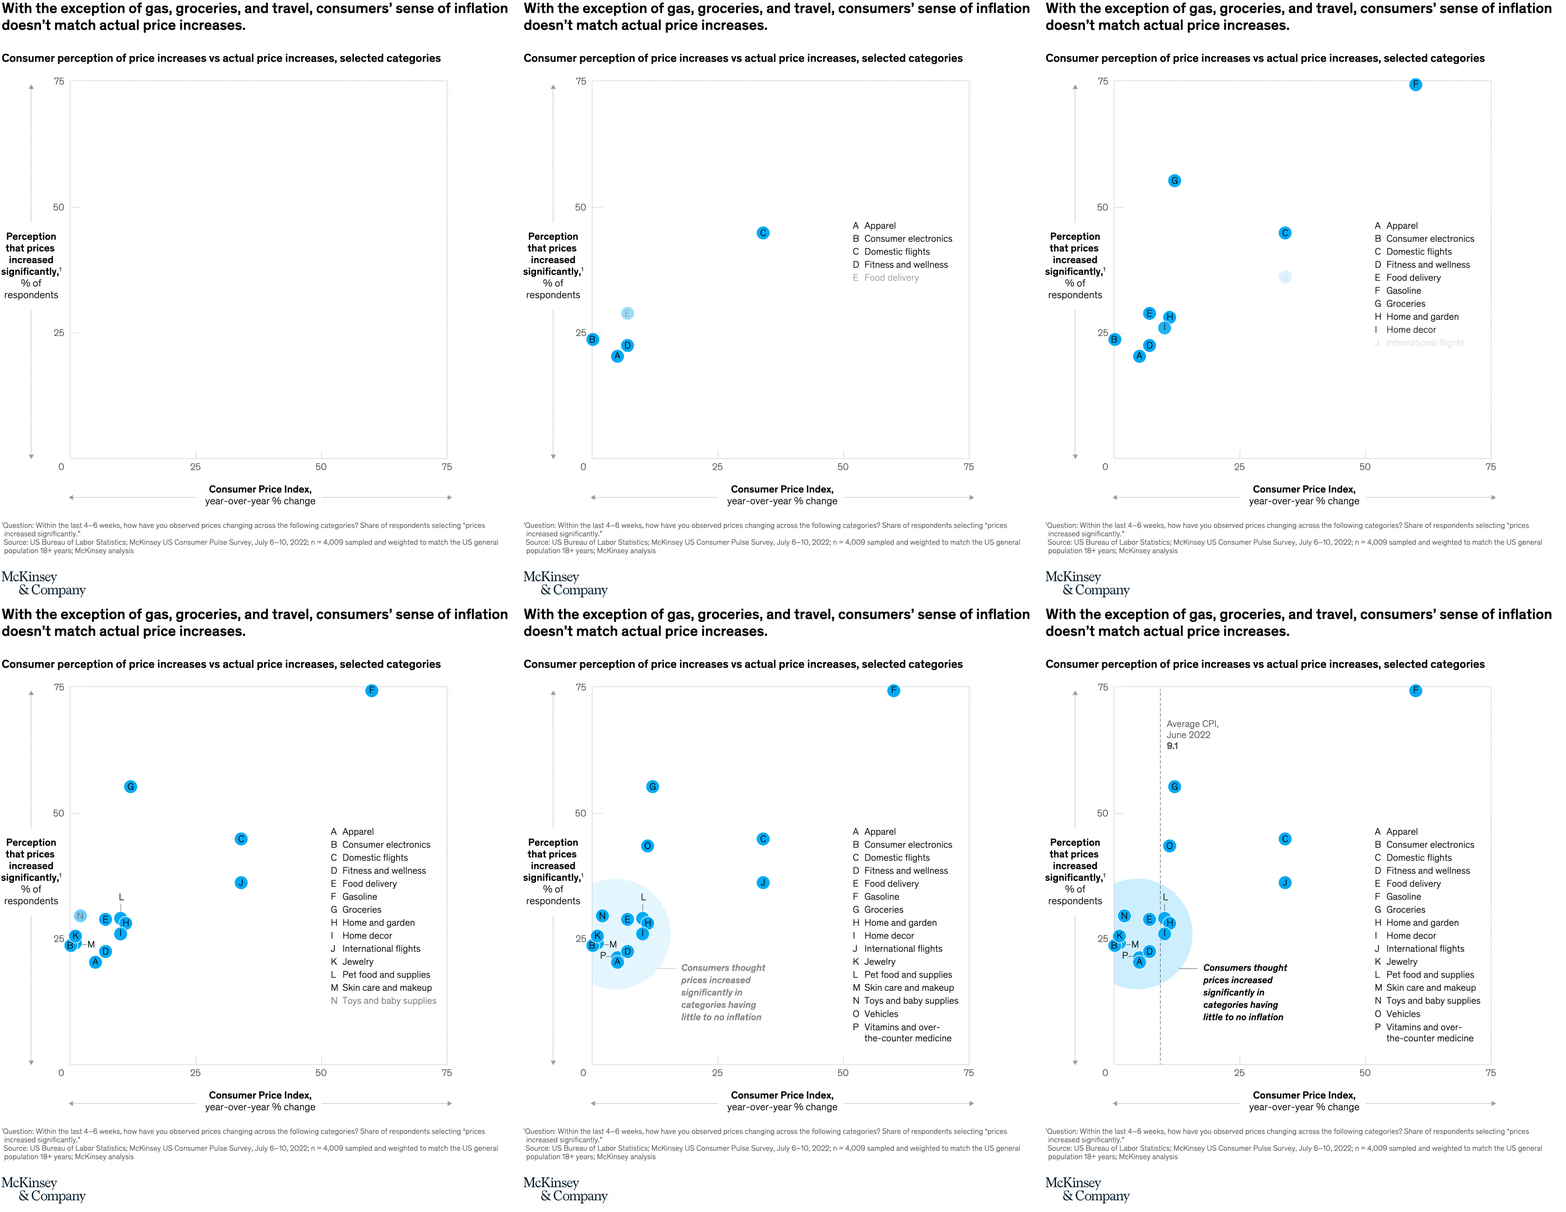
September 15, 2022 – Perceptions of inflation don’t always match reality—that’s one of the insights from our latest Consumer Pulse Survey. For example, US consumers believe that prices for gas and groceries have skyrocketed, which tracks with actual price increases. However, when it comes to consumer electronics, skin care and makeup, and toys and baby supplies, around 30 percent of respondents think that there’s been a significant markup in prices in at least one of these categories. The inflation for such products has been less than 2 percent.
To read the article, see “The Great Uncertainty: US consumer confidence and behavior during inflationary times,” August 16, 2022.
customizer here
Visual form
Grouped bar chart.
Layout / body structure
The page uses a single comparison chart, read across product categories and then down to the note after the visual.
What is being compared
The chart compares consumer perceptions of inflation with actual inflation across different categories, including gas, groceries, consumer electronics, skin care and makeup, and toys and baby supplies.
Measurement system
The key measures are percentages and category-level inflation rates, so the reader is comparing perceived price increases against actual price changes within the same product groups.
Visible structure inside the graphic
The chart is organized as paired category comparisons, letting the reader see where perceived inflation and actual inflation move together and where they break apart.
Main takeaway from the visual
The visual shows that inflation perception is accurate in some high-visibility essentials such as gas and groceries but materially overstated in several discretionary product categories.
Key standout values or extremes
The strongest anchored values on the page are that around 30 percent of respondents believe there has been a significant markup in at least one of the electronics, skin-care-and-makeup, or toys-and-baby-supplies categories, even though inflation for such products has been less than 2 percent.
Controls / sequence, when applicable
This is a static chart image with no in-chart controls to operate.
Companion media, when applicable
There is no separate companion audio or video; the chart image is the full visual on this page.